As someone interested in the future of DeFi (decentralized finance), I wanted to better track the price of different cryptocurrencies and store them into a timeseries database for further analysis. I found an interesting talk by Ludvig Sandman and Bruce Zulu at Kafka Summit London 2019, Using Kafka Streams to Analyze Live Trading Activity for Crypto Exchanges, so I decided to leverage Kafka and modify it for my own use.
QuestDB is a fast, open-source, timeseries database with SQL support. This makes it a great candidate to store financial market data for further historical trend analysis and generating trade signals. The team has released an official QuestDB Kafka connector. Underneath the hood, the new connector uses InfluxDB line protocol (ILP), which has excellent ingestion performance and easy schema management. So I decided to give this a spin and apply it to my project, kafka-crypto-questdb.
Prerequisites
- Docker with at least 4GB memory
- Python 3.7+ and pip
- GitHub repository which contains the source for the examples below
Note: Memory can be increased on Docker Desktop in Settings -> Resources
-> Memory and increasing the default limit from 2GB to 4GB.
Project setup
At a high level, this project polls the public Coinbase API for the price of Bitcoin, Ethereum, and Chainlink. This information was then published onto individual topics on Kafka (e.g. topic_BTC) and sent to QuestDb via Kafka Connect:

git clone https://github.com/Yitaek/kafka-crypto-questdb.git
The codebase is organized into three parts:
-
docker: Dockerfile to set up the Kafka Connector
-
docker-compose: holds docker-compose file to start Kafka (zookeeper, broker, kafka connect), QuestDB, and JSON file to initialize Kafka Connect
-
Python files: grabs latest pricing information from Coinbase and publishes information to Kafka
Docker
First, I installed the QuestDB Kafka Connector files:
 FROM alpine:latest AS builder
 RUN wget https://github.com/questdb/kafka-questdb-connector/releases/download/v0.4/kafka-questdb-connector-0.4-bin.zip && \
     unzip kafka-questdb-connector-*-bin.zip
 FROM confluentinc/cp-kafka-connect:7.3.0
 COPY --from=builder /kafka-questdb-connector/*.jar /usr/share/java/kafka/
The above Dockerfile simply downloads the binaries for the connector and copies the JAR files to the location Kafka Connect expects.
Run docker-compose
Next, the docker compose file exposes port 9009 (ILP) on QuestDB instead of 8812 (PostgreSQL):
questdb:
  image: questdb/questdb:6.6.1
  hostname: questdb
  container_name: questdb
  ports:
    - "9000:9000"
    - "9009:9009"
At this point, we have all the necessary components for the demo so started the stack via docker compose:
$ cd docker-compose
$ docker compose up
The docker-compose file runs the following services:
- QuestDB
- Zookeeper for Kafka config information, distributed sync, and group services
- Kafka Broker for receiving and storing messages and for consumers to fetch messages by topic
- Kafka Connect with the QuestDB Kafka Connector
Query the data with Python files
To finish the setup, I first created the Kafka Connect sink:
$ curl -X POST -H "Accept:application/json" -H "Content-Type:application/json" --data @questdb-sink-btc.json http://localhost:8083/connectors
The curl command above submitted a JSON file which contains the configuration for the QuestDB Kafka Connector:
{
  "name": "questdb-sink-btc",
  "config": {
    "connector.class": "io.questdb.kafka.QuestDBSinkConnector",
    "tasks.max": "1",
    "topics": "topic_BTC",
    "key.converter": "org.apache.kafka.connect.storage.StringConverter",
    "value.converter": "org.apache.kafka.connect.json.JsonConverter",
    "key.converter.schemas.enable": "false",
    "value.converter.schemas.enable": "false",
    "host": "questdb",
    "timestamp.field.name": "timestamp",
    "symbols": " currency"
  }
}
The important things to notice here are:
-
value.converter.schemas.enable: since there is no schema in messages and we do not use Schema Registry either, we have to set this value tofalse. -
timestamp.field.name: the connector supports designated timestamps either in integer or timestamp format. For integers, units will be autodetected as long as the field name is configured.
For a full list of configuration options, refer to the configuration manual.
Then I started a Python script polling for the latest prices:
$ pip install -r requirements.txt
$ python getData.py
Navigating to the console UI at http://localhost:9000, we can see the prices of Bitcoin being ingested:
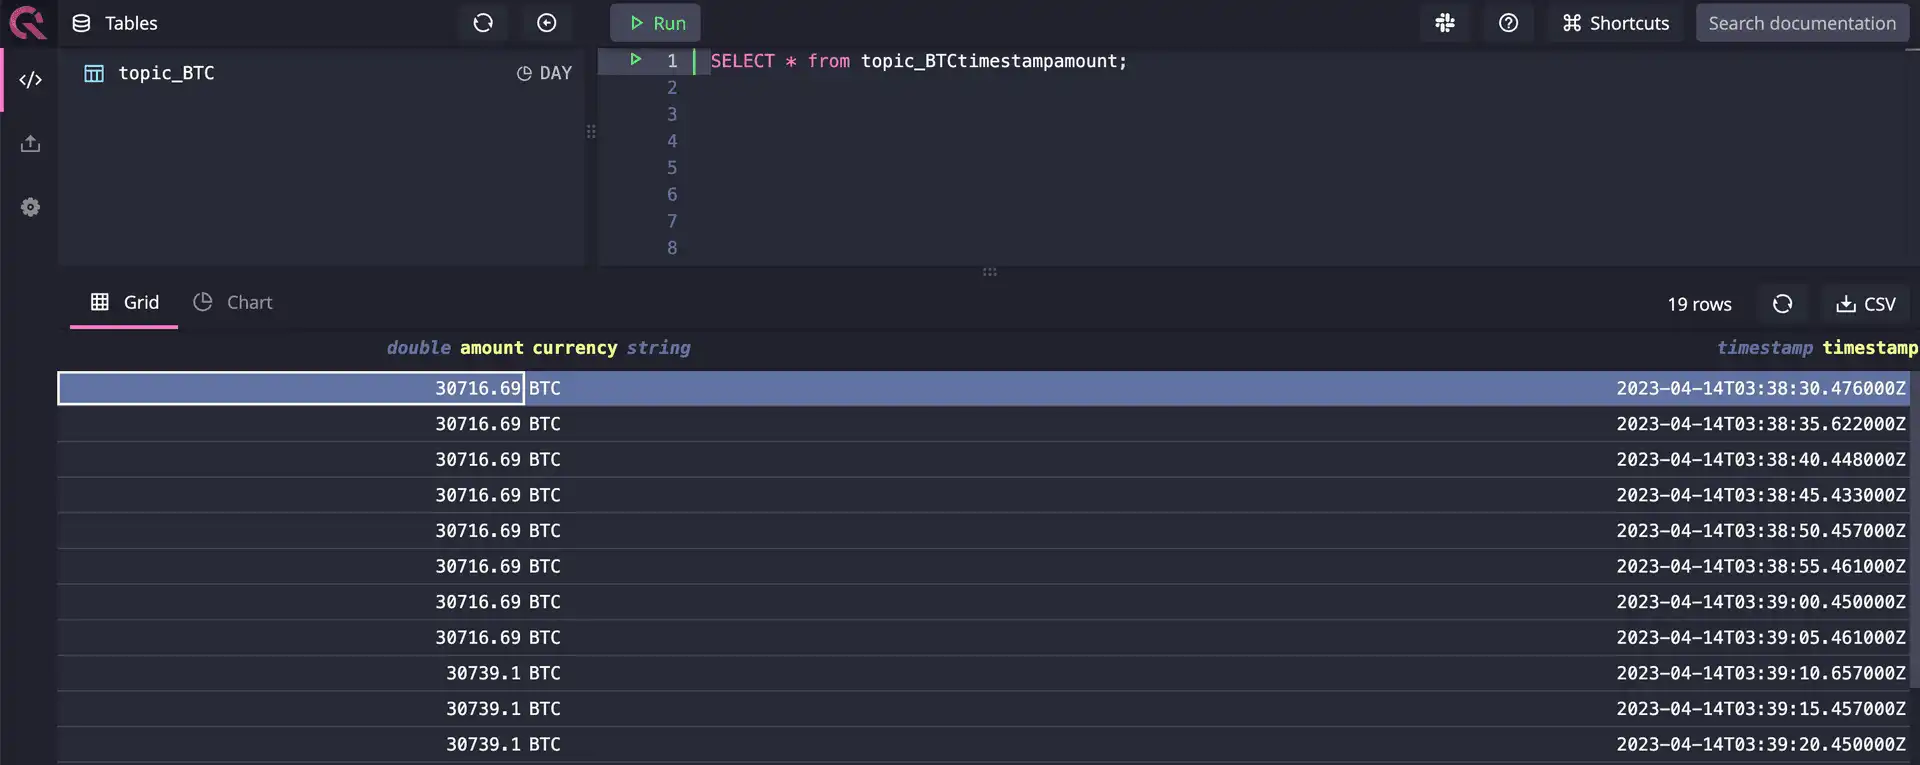
You can repeat this process for the other topics as well. If you prefer to run without a UI, you can also use the REST API to check:
curl -G \
--data-urlencode "query=select * from topic_BTC" \
http://localhost:9000/exp
Visualize the data
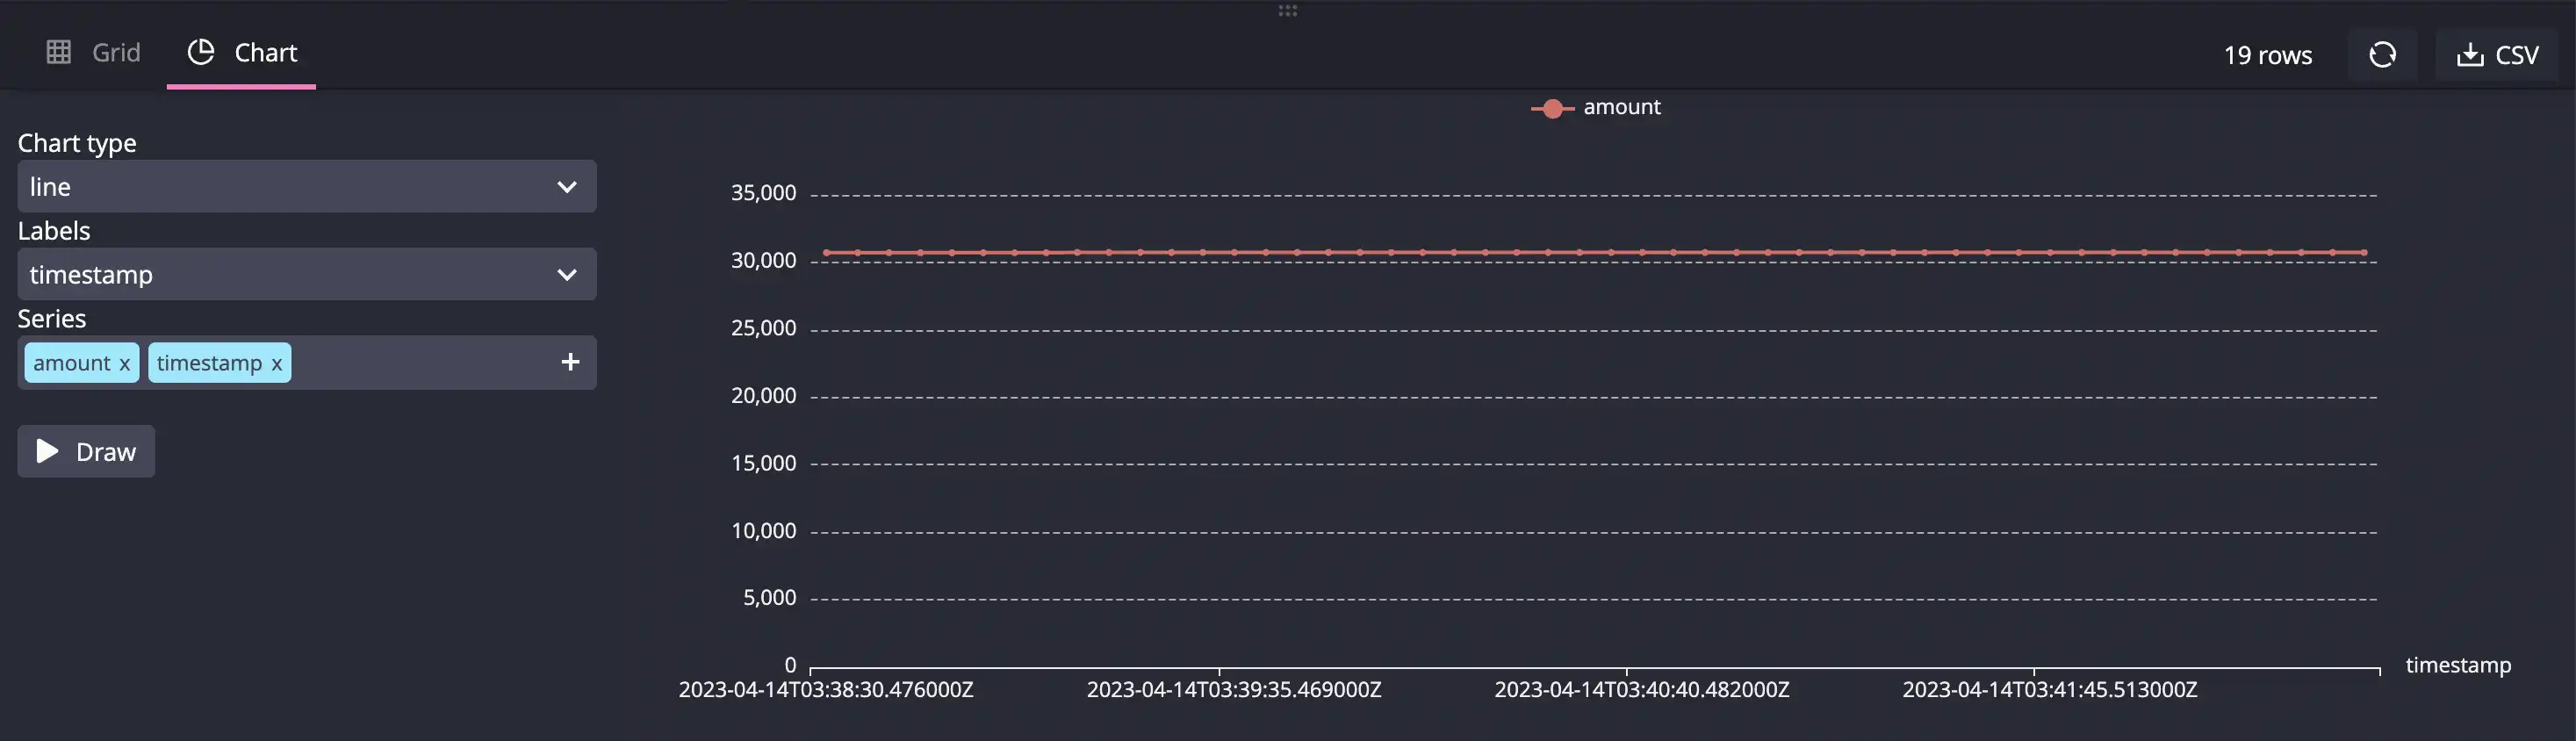
The QuestDB console UI also provides the ability to generate basic graphs:
- Click on the Chart tab underneath the Tables
- Select
lineas the chart type,timestampas the label - Click Draw
The QuestDB native charting capabilities are limited to a few graph types, so for more advanced visualization, check out Time-Series Monitoring Dashboard with Grafana and QuestDB.
Wrapping up
To stop streaming data, simply stop the Python scripts. To stop and remove the Kafka cluster / QuestDB services, run:
docker-compose down
The overview page for the QuestDB Kafka connector on the QuestDB website lists more information on the configuration details and FAQs. The GitHub repo for the connector also has sample projects including a Node.js and a Java example for those looking to leverage a reference architecture.