 Case study
QuestDB for high-performance big data workloads
QuestDB is used as part of a big data solution used in Telecommunications, which requires writing millions of records while querying a constantly changing data set for real-time analytics.
![]() Lower operational costs
Lower operational costs
![]() Simple setup and maintenance using QuestDB Docker image
Simple setup and maintenance using QuestDB Docker image
![]() Integrations with existing tools using the REST API
Integrations with existing tools using the REST API
![]() Real-time results despite massive throughput
Real-time results despite massive throughput
![]() Reactive support from QuestDB engineering
Reactive support from QuestDB engineering
![]() Reliable and fast query times for insights
Reliable and fast query times for insights
We’re developing big data solutions for financial transactions, BI systems, IT infrastructure, security, and network operators. Our services include real-time analytics of the network infrastructure of Türk Telekom, the largest Telecommunications provider in Turkey.
In this case study, we summarize why the team chose QuestDB, their migration experience, and the improvements they gained in query speed, maintainability, and compatibility.
Migrating big data timeseries workloads to QuestDB
We found QuestDB because of our requirements to store and analyze massive amounts of data that needs to be served to users quickly. The data we collect needs to be presented to customers in a way that it’s easy to understand how it changes over time. The search for a database that can display this kind of information in a timeline as fast as possible led to QuestDB.
Türk Telekom is one of the largest telecommunications providers in Turkey, serving internet connections to over 5 million customers. Infrastructure at this scale uses massive amounts of resources and generates a tremendous volume of data. We use operational data from this provider to show their customers information about their own internet connections, such as the quality of service, download speed, upload speed, bandwidth, and more.
How we collect and analyze big data with QuestDB
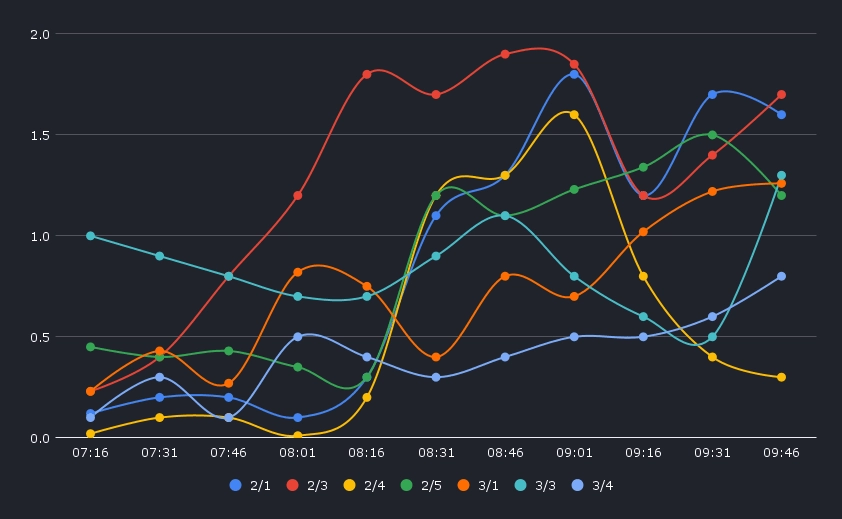
We store the bandwidth data of devices in Fiber To The Home (FTTH) topology from collectors, which run on hourly intervals. These collector jobs contain time series for each device in JSON format and based on this metadata, we produce visualizations for our customers so that they have insights into their network quality. For a customer, this means that they have access to charts, tables, and line graphs so they can see the state of their connectivity for the last 30 days.
Why we use QuestDB for big data
The original stack relied on MongoDB to store connectivity information, which was convenient at first. However, it soon became apparent that MongoDB was tightly dependent on physical resources and required more powerful hardware. As data sets grew in MongoDB, query speeds degraded below what was acceptable for our customers.
For communicating with QuestDB, we uses the QuestDB Docker image for running production instances and the REST API to query data for charts and insights. On average, we’re writing hundreds of millions of records per day while performing calculations on an ever-changing data set. Usually, we will keep 30 days of data in QuestDB and delete older partitions when they become less useful for actionable insights.
“QuestDB allows us to query data while writing millions of records. It is an excellent database for time series analysis and can efficiently store our data. QuestDB’s community is constantly growing and its popularity is on the rise.”
Erdem Aydemir, Innova (Türk Telekom)