Photo by Louis Reed via Unsplash
This submission comes from one of our community contributors Yitaek Hwang who has put together a nice guide for streaming fitness data into QuestDB with Google Cloud Platform.
Thanks for your contribution, Yitaek!
Background
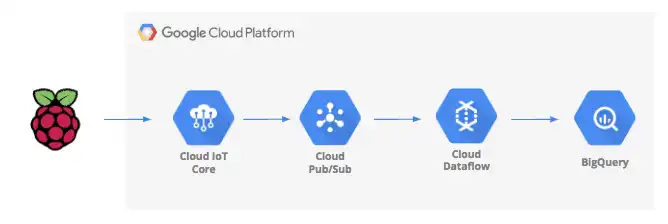
Thanks to the growing popularity of fitness trackers and smartwatches, more people are tracking their biometrics data closely and integrating IoT into their everyday lives. In my search for a DIY heart rate tracker, I found an excellent walkthrough from Brandon Freitag and Gabe Weiss, using Google Cloud services to stream data from a Raspberry Pi with a heart rate sensor to BigQuery via IoT Core and Cloud Dataflow.
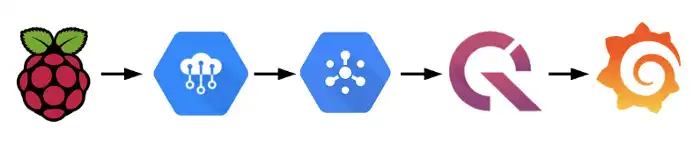
Although Cloud Dataflow supports streaming inserts to BigQuery, I wanted to take this opportunity to try out a new time-series database I came across called QuestDB. QuestDB is a fast open-source time-series database with Postgres and Influx line protocol compatibility. The live demo on the website queries the NYC taxi rides dataset with over 1.6 billion rows in milliseconds, so I was excited to give this database a try. To round out the end-to-end demo, I used Grafana to pull and visualize data from QuestDB.
Prerequisites
In this tutorial, we will use a Debian image and a Python script to send simulated sensor data through IoT Core.
Google Cloud Setup
In order to use Cloud IoT Core and Cloud Pub/Sub, you need to first create a
Google Cloud Platform account and a new project (mine is called
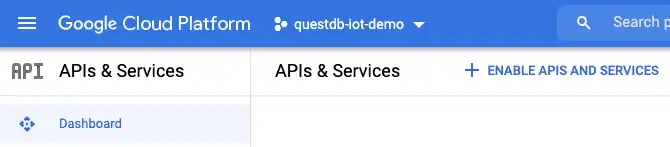
questdb-iot-demo ). Navigate to
APIs & Services -> Enable APIs and Services -> Search for APIs & Services
and enable the following APIs:
- IoT Core
- Pub/Sub
- Compute Engine
IoT Core
IoT Core is Google's fully-managed IoT service to help securely connect and
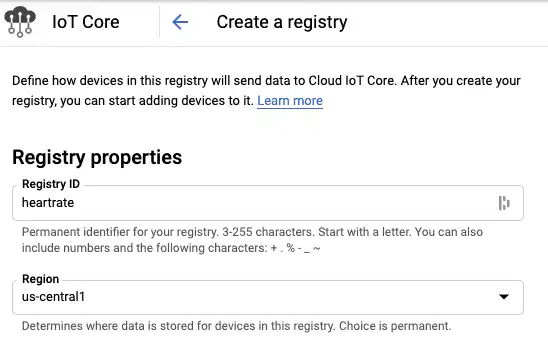
manage IoT devices. In this demo, we will create a registry called heartrate
and send MQTT data. Click on Create Registry and set the Registry ID and
Region based on the geographic region closest to you (for me it was
us-central1):
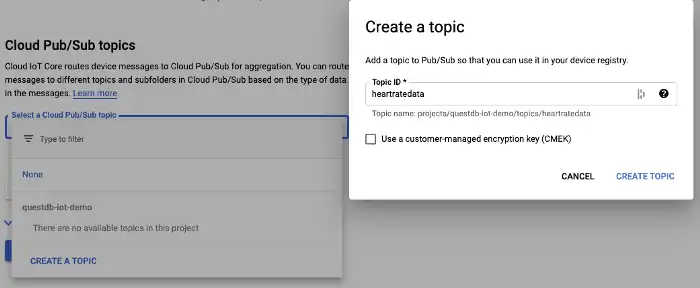
Next, we need to configure a Pub/Sub topic to publish device data to. Under
"Select a Cloud Pub/Sub topic", click on Create a Topic and give it the
Topic ID heartratedata:
Once the registry properties and Cloud Pub/Sub topics are configured, click on Create
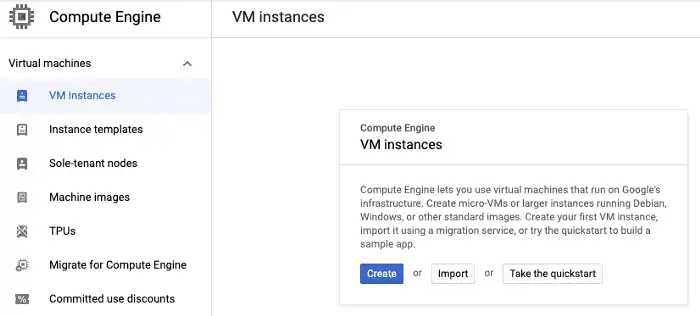
Compute Engine
Now it's time to add our simulated device. In order for our device to communicate with IoT Core, we need to add a public key. Head over to Compute Engine -> Create.
The default options (e2-medium, Debian 10 image, us-central1) will work for
our simulator. Make sure to match the region with the IoT Core registry region
if you chose something other than us-central1. Once the VM is ready, click on
the SSH button under "Connect" and install the project code with the
following commands:
# Install git
sudo apt-get update sudo apt-get install git
# Clone project code
git clone https://github.com/googlecodelabs/iotcore-heartrate && cd iotcore-heartrate
# Install all the core packages
chmod +x initialsoftware.sh ./initialsoftware.sh
# Generate the keys
chmod +x generate_keys.sh ./generate_keys.sh
# View and copy the keys
cat ../.ssh/ec_public.pem
Pub/Sub
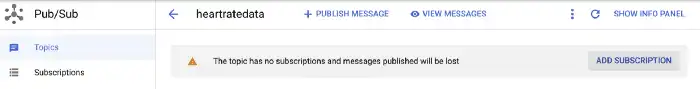
Finally, we need to create a subscription to our Pub/Sub topic to pull messages
and insert into QuestDB. Head over to "Pub/Sub" and click on our heartratedata
topic. Give the subscription the name questdb and click Create.
IoT Device Setup
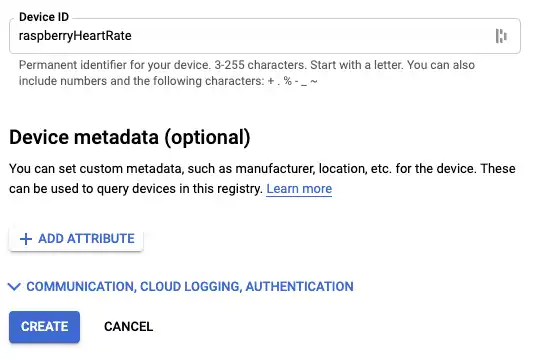
Once you have the ec_public.pem key, head back to the IoT Core Registry. Under
"Devices", click on Create a Device. For Device ID, enter
raspberryHeartRate and expand the Communication, Cloud Logging,
Authentication dropdown:
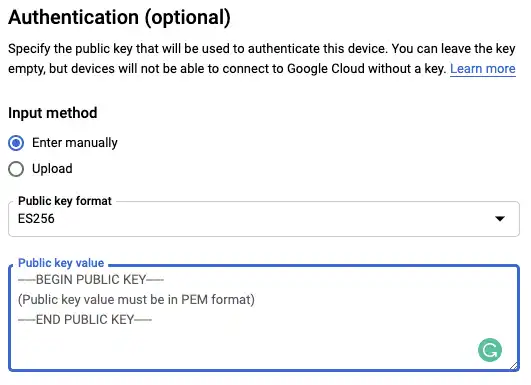
Under Authentication, change the Public key format to ES256, paste in the
key from our VM or Raspberry Pi and click "Create":
QuestDB Setup
At this point, we have everything on Google Cloud to send data to our Pub/Sub topic. Now we need to write some code to take those messages and insert them into QuestDB. Let's start by starting up QuestDB via Docker.
docker run --name questdb-heartrate -p 9000:9000 -p 8812:8812 questdb/questdb
The above command pulls the latest QuestDB image (v5.0.6) and maps port 9000
for the console UI and port 8812 for Postgres connections. By giving the
container the name questdb-heartrate we can refer to the container later on
after it has been stopped and the heart rate data is persisted:
# bring the container up
docker start questdb-heartrate
# shut the container down
docker stop questdb-heartrate
Open up the QuestDB console at http://127.0.0.1:9000/ and create our
heart_rate table:
CREATE TABLE heart_rate(sensorID STRING, uniqueID STRING, timecollected
  TIMESTAMP, heartrate DOUBLE) timestamp(timecollected);
Note: If you don't see the heart_rate table populated on the tables and
schema explorer panel, click on the refresh icon above the tables.)
Pub/Sub to QuestDB
Since there's no native integration for Pub/Sub, we will need to write a simple program to listen to new Pub/Sub messages and insert the data into QuestDB. I'm using NodeJS v14.15.4, but you can use similar client libraries for Pub/Sub and Postgres to achieve the same.
First, configure the gcloud SDK to authenticate with your GCP project without
having to download a service account (see
Simple GCP Authentication with Service Accounts
for more details).
# Set default profile
gcloud auth application-default login
Next, create a new NodeJS workspace and install @google-cloud/pubsub and pg packages. You can use the code below to listen to Pub/Sub and stream to QuestDB:
// Modified from https://github.com/googleapis/nodejs-pubsub/blob/master/samples/listenWithCustomAttributes.js
const { PubSub } = require("@google-cloud/pubsub")
const { Client } = require("pg")

// Default connection settings https://questdb.io/docs/configuration/#postgres-wire-protocol
const client = new Client({
  user: "admin",
  host: "localhost",
  database: "qdb",
  password: "quest",
  port: "8812",
})

async function main(subscriptionName = "questdb", timeout = 60) {
  const pubSubClient = new PubSub()
  await client.connect()

  async function listenForMessages() {
    const subscription = pubSubClient.subscription(subscriptionName)
    // Create an event handler to handle messages
    const messageHandler = async (message) => {
      // Parse Pub/Sub message into JSON
      const data = Buffer.from(message.data, "base64").toString("utf-8")
      const parsedMessage = JSON.parse(data)
      // Get each field and transform time into ts format
      const { sensorID, uniqueID, timecollected, heartrate } = parsedMessage
      // Using timestamp in microseconds: https://questdb.io/docs/reference/sql/datatypes/
      const ts = Date.parse(timecollected) * 1000

      const text =
        "INSERT INTO heart_rate(sensorID, uniqueID, timecollected, heartrate) VALUES($1, $2, $3, $4)"
      const values = [sensorID, uniqueID, ts, heartrate]

      const res = await client.query(text, values)
      message.ack()
    }

    // Listen for new messages until timeout is hit
    subscription.on("message", messageHandler)
    setTimeout(async () => {
      subscription.removeListener("message", messageHandler)
      console.log("done")
      await client.end()
    }, timeout * 1000)
  }

  listenForMessages()
}

process.on("unhandledRejection", (err) => {
  console.error(err.message)
  process.exitCode = 1
})

main()
Sending Data
Finally, we are ready to send the simulated data. Switch back to the Compute Engine and ssh into the VM again. Issue the command below to send the data to our IoT Core device:
python3 heartrateSimulator.py --project_id=questdb-iot-demo \
  --registry_id=heartrate --device_id=raspberryHeartRate \
  --private_key_file=../.ssh/ec_private.pem
If successful, you should see some logs like:
... Publishing message #544: '{"sensorID": "heartrate.raspZero", "heartrate":
72.56881801680139, "uniqueID":
"c1ca9656-671f-4fa7-8c03-12fdfb4f422f-heartrate.raspZero", "timecollected":
"2018-07-07 20:54:50"}'Publishing message #545: '{"sensorID":
"heartrate.raspZero", "heartrate": 72.8324264524384, "uniqueID":
"8d6337b7-204f-4209-88c0-46a79d1911bb-heartrate.raspZero", "timecollected":
"2018-07-07 20:54:59"}' Finished.
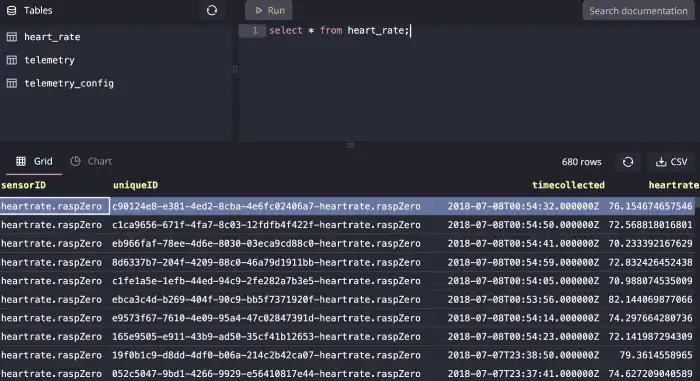
Now run our NodeJS code and we should see data populated in QuestDB:
Visualizing Data with Grafana
Although QuestDB console provides some default visualizations out of the box, to simulate a scenario of combining all the metrics, we'll set up a Postgres data source and visualize our heart rate data. To start Grafana from Docker, run the following:
docker run -p 3000:3000 grafana/grafana
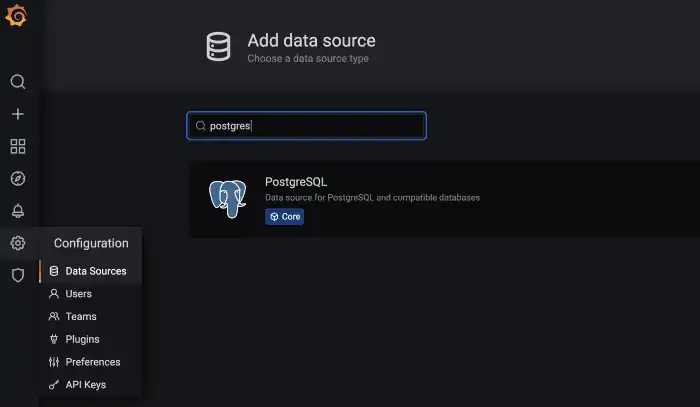
Navigate to http://localhost:3000/login using the
default credentials (admin:admin). Under Configuration -> Data Sources,
search for Postgres:
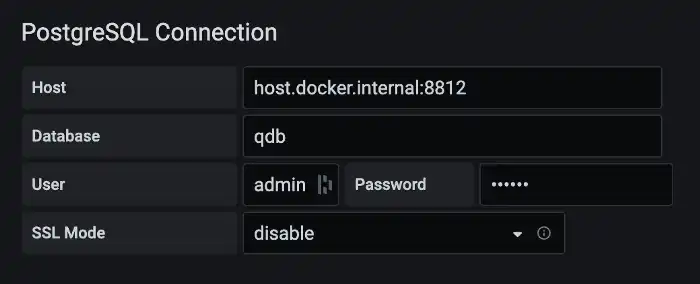
Provide the following login credentials (password: quest), ensure SSL is
disabled and click Save and Test:
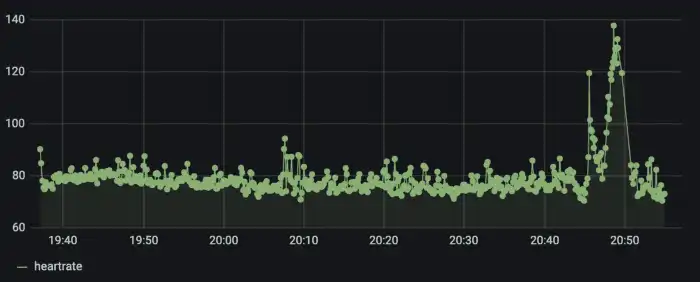
Finally, let's create a dashboard. Add a panel to the Grafana dashboard and add the following SQL query:
SELECT timecollected AS "time",
       heartrate
FROM heart_rate
ORDER BY time;
If all is working as expected, we can now see the sample heart rate data:
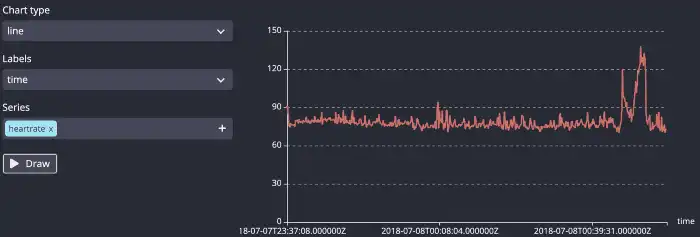
If we run the same query on QuestDB, we have the option to visualize the same data points there for comparison using the Chart feature:
Summary
At this point, we have an end-to-end system of a device securely sending data
via IoT Core and streaming data into QuestDB. We can extend this example to
multiple devices by adding them under IoT Core and scaling our server to using
pooled connections to more efficiently add data to QuestDB. At scale, we can
also look at aggregates instead of raw data points, (e.g.
avg(heartrate) as avg_hr from heart_rate SAMPLE BY 1d)
If you like this content, we'd love to know your thoughts! Feel free to share your feedback or just come and say hello in the QuestDB Community Slack.