Optimizing the Optimizer: the Time-Series Benchmark Suite
The Time-Series Benchmark Suite, or TSBS, is a well-known benchmarking tool for anyone who's into time-series databases. While not ideal, just like any other benchmark, it does a decent job representing common workloads for a time-series database.
Timescale created TSBS based on another benchmark tool from the InfluxDB team. Here at QuestDB, we've been using TSBS to measure and optimize ingestion and query performance for a few years already. Today we'd like to introduce our own TSBS fork, share the story of the optimization we made, and explain why we ended with a fork instead of contributing to the upstream repo (spoiler: we did that too).
In search of the bottleneck
We've been using TSBS to measure and compare ingestion throughput for a few years. Considering that QuestDB implements InfluxDB Line Protocol (ILP) over TCP, it's not a secret that our initial implementation of the QuestDB TSBS module was based on the InfluxDB one. We had a great start. However, we eventually discovered that the optimizations in the database had little to no effect on the TSBS results.
The most obvious explanation would be that all optimizations we were adding were worthless, but what if TSBS was the bottleneck?
Luckily that was simple to test.
A meaningful approach to optimize any client-side library, such as a database
driver or a benchmark tool, is to swap the server with a no-op implementation
and then profile the library. In our case, swapping QuestDB's ILP server is as
simple as running socat with the following command:
socat /dev/null,ignoreeof tcp-listen:9009,fork,reuseaddr
This command runs socat TCP proxy server that consumes the data sent over the
socket and sends it to /dev/null. The only thing this no-op server does is the
network I/O, so it should make all client-side bottlenecks much more obvious.
With the socat server, we got the following result with four worker
goroutines:
$ ./tsbs_load_questdb --file /tmp/data --workers 4time,per. metric/s,metric total,overall metric/s,per. row/s,row total,overall row/s1684330223,14634364.80,1.464000E+08,14634364.80,1463436.48,1.464000E+07,1463436.481684330233,14712618.43,2.936000E+08,14673493.89,1471261.84,2.936000E+07,1467349.391684330243,14703414.28,4.406000E+08,14683462.86,1470341.43,4.406000E+07,1468346.291684330253,14805896.85,5.886000E+08,14714057.21,1480589.68,5.886000E+07,1471405.72Summary:loaded 691200000 metrics in 46.962sec with 4 workers (mean rate 14718346.10 metrics/sec)loaded 69120000 rows in 46.962sec with 4 workers (mean rate 1471834.61 rows/sec)
1.47M rows/s isn't awful, but we can probably do better. The next step was to profile the loader and check any bottlenecks. But how does one profile TSBS?
TSBS is written in Golang, which has a great
built-in profiler called pprof. While it's
capable of collecting different kinds of profiles, it usually makes sense to
start with the CPU profile. After collecting the profile, we found the following
CPU profile graph:
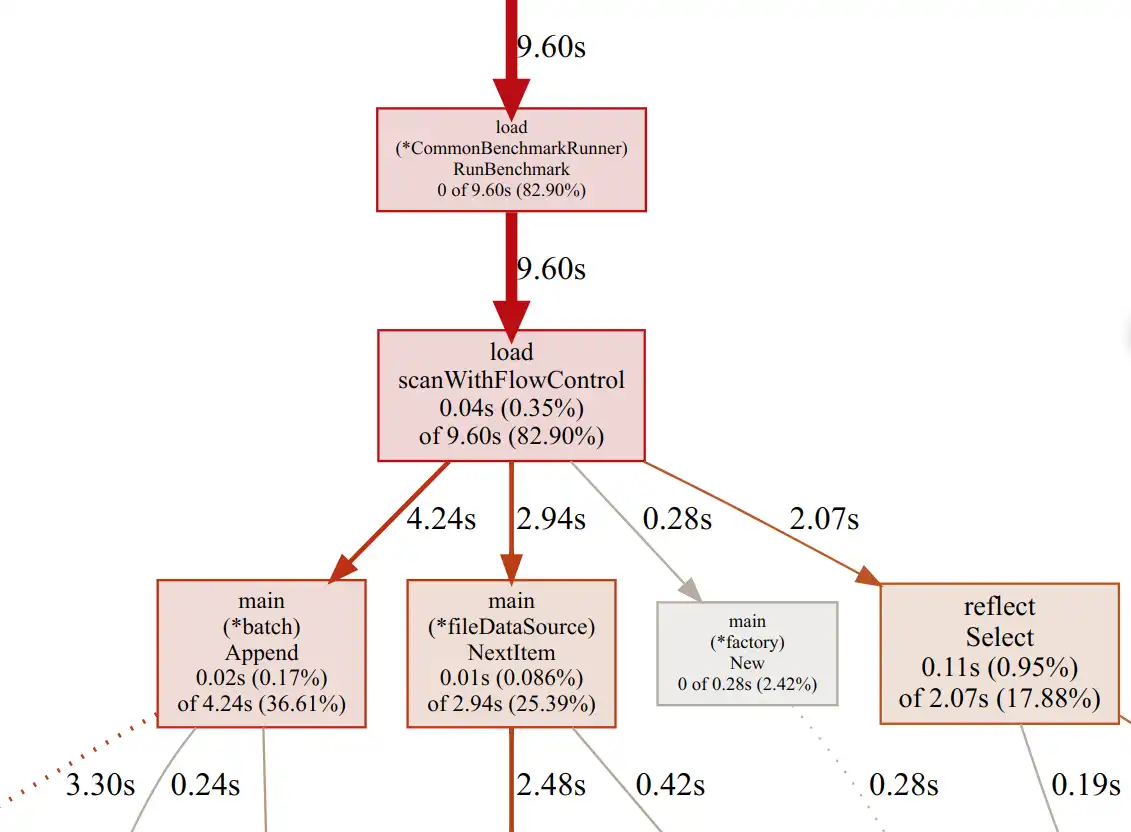
Here, the NextItem calls were doing buffered disk I/O, which is inevitable
when running a TSBS benchmark. First, TSBS generates an input file with ILP
messages, and then a separate loader program to send the data to the target
database.
Two remaining significant call sites from the graph were the Append function
from the QuestDB loader and the reflect.Select function from the standard
library. The reflect.Select function is essential for the so-called flow
control code used in the TSBS loader. It's not easy to swap it with something
faster. Therefore, we decided to check the Append code first.
Here is what the function looked like:
func (b *batch) Append(item data.LoadedPoint) {that := item.Data.([]byte)thatStr := string(that)b.rows++// Each influx line is format "csv-tags csv-fields timestamp", so we split it with a space// and then on the middle element, we split by comma to count the number of fields addedargs := strings.Split(thatStr, " ")if len(args) != 3 {fatal(errNotThreeTuplesFmt, len(args))return}b.metrics += uint64(len(strings.Split(args[1], ",")))b.buf.Write(that)b.buf.Write(newLine)}
If you're not familiar with Go, no worries. The above code writes the read line
to the downstream buffer. It also validates the line for a valid ILP message,
i.e. a string of the "csv-tags csv-fields timestamp" format. This check is
expensive as it involves byte slice-to-string conversion in addition to a couple
of strings.Split calls.
While they don't sound scary, these steps were done on the hot path for each ILP message. Per-row validation is a nice-to-have, but that's something we can live without, when optimizing a benchmark tool. So, we ended with relaxed validation, done for a single row per batch of rows (10K rows by default).
With this version of the Append function we got the following:
$ ./tsbs_load_questdb --file /tmp/data --workers 4time,per. metric/s,metric total,overall metric/s,per. row/s,row total,overall row/s1684330968,28746161.10,2.875000E+08,28746161.10,2874616.11,2.875000E+07,2874616.111684330978,28368365.36,5.712000E+08,28557270.40,2836836.54,5.712000E+07,2855727.04Summary:loaded 691200000 metrics in 24.163sec with 4 workers (mean rate 28605403.46 metrics/sec)loaded 69120000 rows in 24.163sec with 4 workers (mean rate 2860540.35 rows/sec)
OK, we jumped from 1.47M to 2.86M rows/s - quite an improvement. We don't want to bother you with the updated code as it's less compact (and more ugly) than the original one, but if you'd like to read it, here is the pull request to check.
This level of TSBS performance was sufficient for our needs until the recent introduction of WAL tables in QuestDB 7.0.1. WAL stands for Write-Ahead-Log, a persistent data structure holding the complete history of table changes. WAL is the foundation of our upcoming replication mechanism. Additionally, its concurrent writer design improved ingestion throughput significantly.
Long story short, 2.86M rows/s wasn't enough anymore and we needed one more
round of optimization. Remember that reflect.Select call site?
Yes, we got rid of it.
This time it was enough to disable the TSBS loader's flow control. This allowed us to use a simpler loader implementation for the QuestDB module. You can check the changes here.
That's what we got with the no-op server:
$ ./tsbs_load_questdb --file /tmp/data --workers 4time,per. metric/s,metric total,overall metric/s,per. row/s,row total,overall row/s1684331599,43206635.89,4.321000E+08,43206635.89,4320663.59,4.321000E+07,4320663.59Summary:loaded 691200000 metrics in 16.064sec with 4 workers (mean rate 43029061.31 metrics/sec)loaded 69120000 rows in 16.064sec with 4 workers (mean rate 4302906.13 rows/sec)
Yes, that's one more jump, from 2.86M to 4.3M rows/s. Again, we're happy with the TSBS performance, at least for the nearest future.
Our TSBS optimization story is over, but we haven't explained why we ended with our own TSBS fork. It's time to fix that.
To fork, or not to fork, that is the question
As you may have noticed, the pull request we mentioned before is still pending. Same story with a bugfix around query generation we created recently. Of course, we're not alone - at the time of writing, there are 25 pending PRs open against the TSBS repo.
Since it's an open-source project, it's totally fine. Since it's an open-source project with a permissive license, we can easily fix the problem by forking it. That's precisely what we did.
So far, our fork includes the above-mentioned optimizations and the bug fix. We also merged InfluxDB v2 support patch since we wanted to be able to run the benchmarks for this database.
We're also open to any contributions and promise to maintain our TSBS fork actively. If you have a patch you want to see in TSBS, don't hesitate to open a PR.
As usual, we encourage you to try the latest QuestDB release and share your feedback with our Community Forum. You can also play with our live demo to see how fast it executes your queries. And, of course, contributions to our open-source database on GitHub are more than welcome.