Case Study
Central Group leverages QuestDB for real-time analytics
QuestDB is the core engine driving real-time analytics data for Central Group, the largest retail company in Asia.
- Superior performance
- Fastest overall performance for user traffic and dashboard queries
- Easy Grafana integration
- Set up Grafana dashboards and panels easily with PostgreSQL Wire Protocol support
- Lower hardware costs
- Since production deployment, Central Group has not increased CPU or RAM usage

- Avg ingested rows/sec
- 3M+
- Write speed vs InfluxDB
- 10x
- Compression ratio
- 6x
- Cloud up-time
- 99.99999%
Analytics at scale
Time-series data, handled
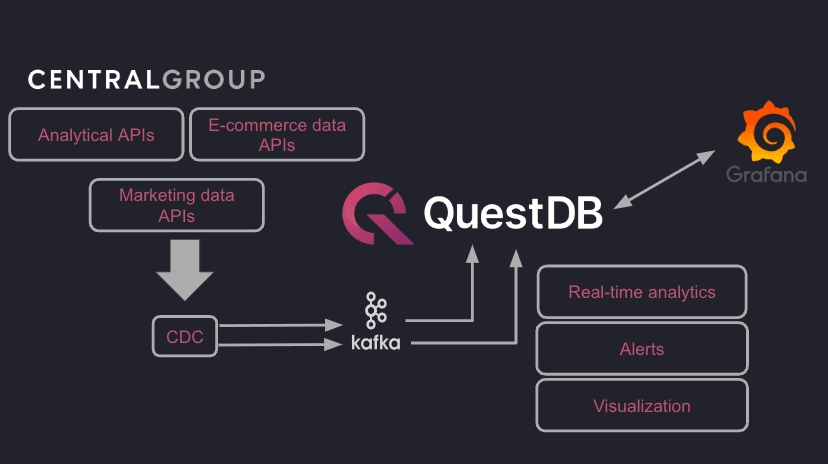
Central Group aggregates data from online and offline sources, delivering insights via actionable dashboards to its business units. Millions of users browser their properties daily, from various devices. Performance, accuracy and stability are paramount.
- Real-Time Monitoring
- QuestDB enables Central Group to monitor their data in real-time, helping them respond to market trends.

"InfluxDB could not accommodate the input scale our APIs demand. Similarly, our in-out requirement was higher than the capacity provided by Google Suite. SingleStore did not provide any sensible recovery mechanisms when the system crashed, and it was also costly. In the end, QuestDB stood out."
Real-time in no time
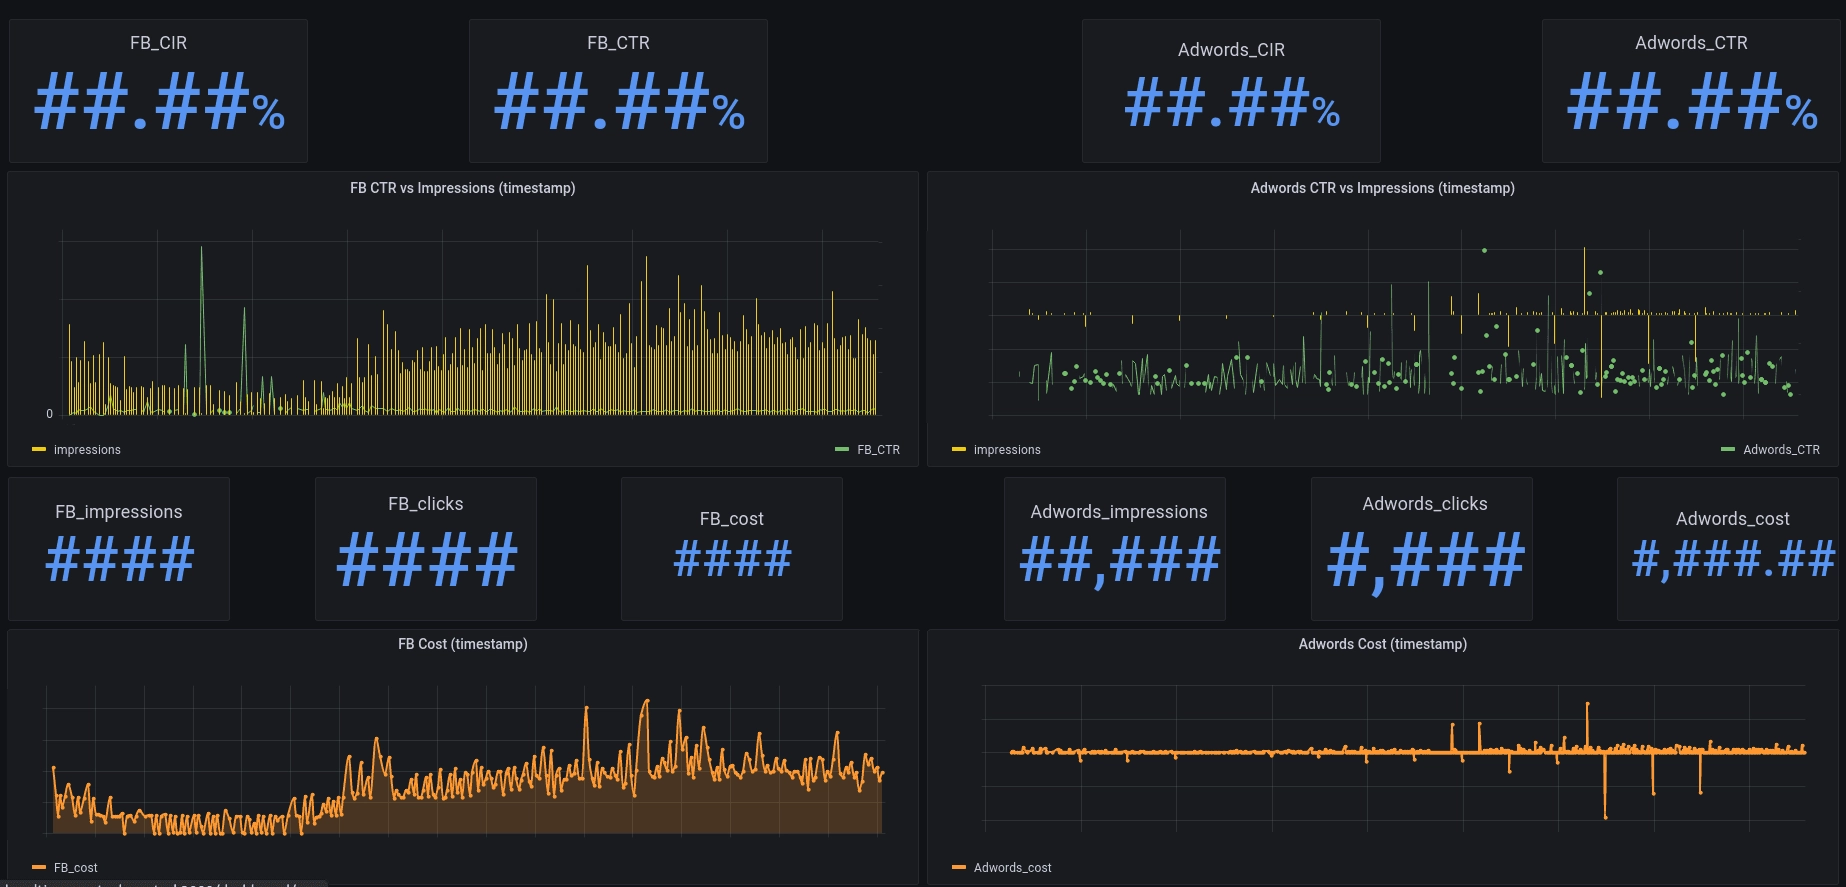
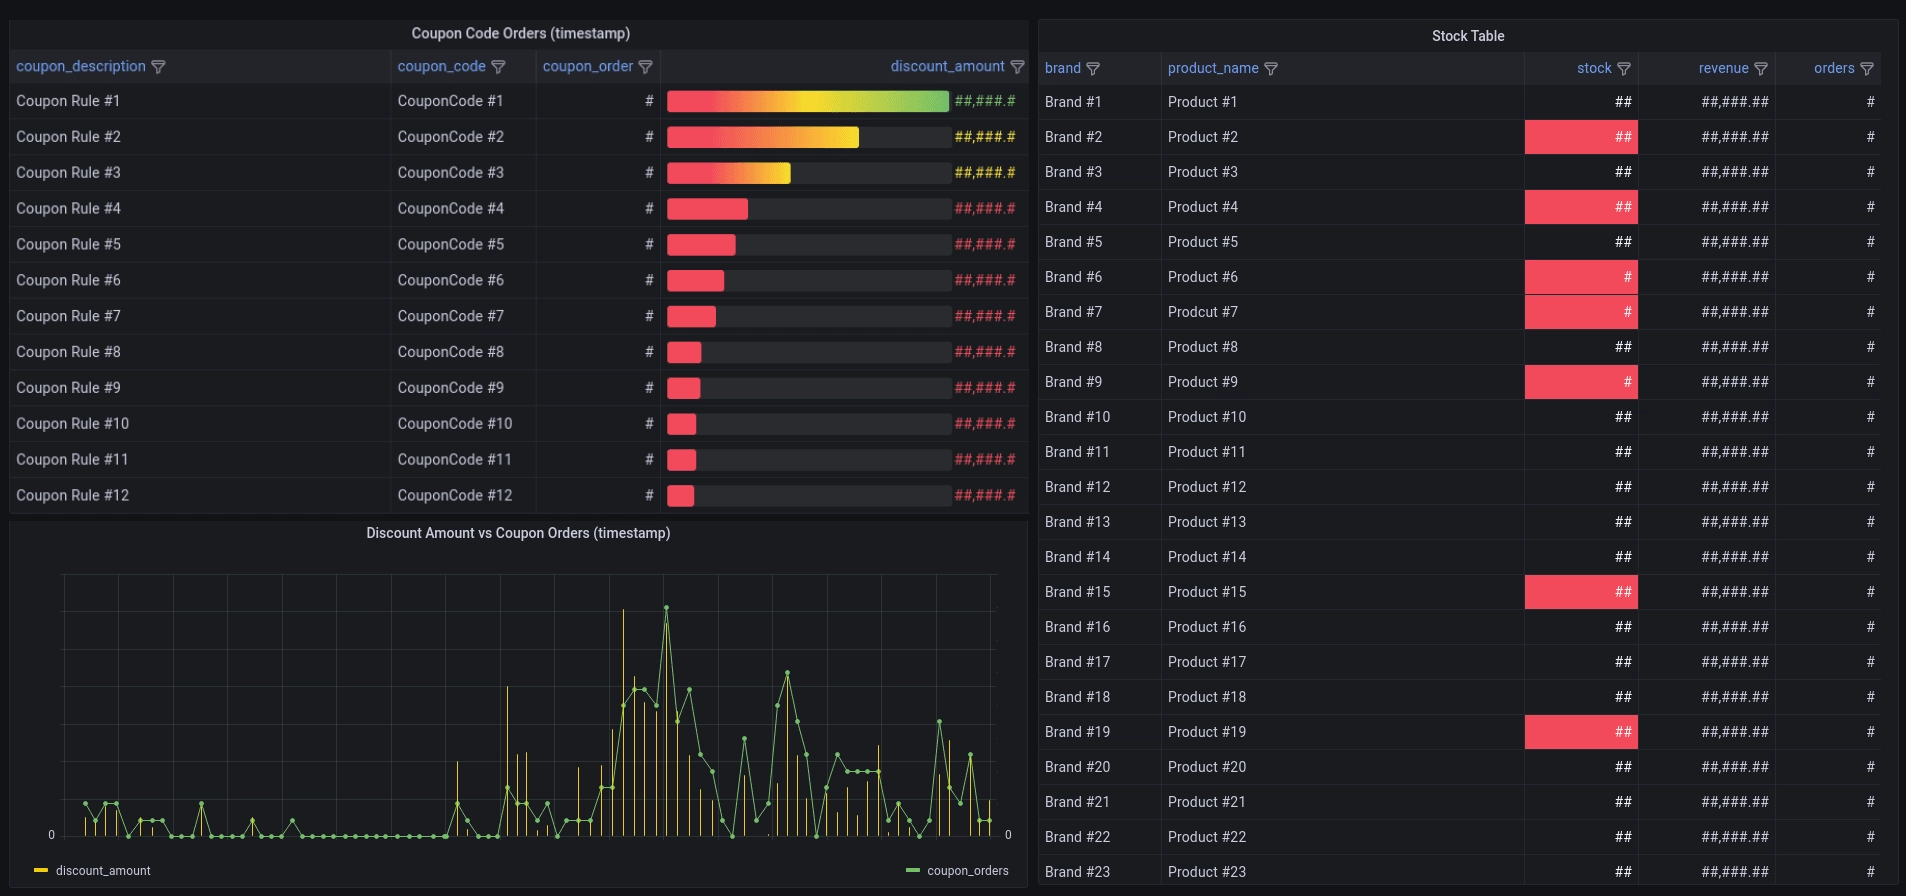
Familiar SQL for Grafana
Central Group uses the Grafana integration to monitor millions of actions.
- Grafana integration
- First-party Grafana integration for real-time dashboards.
- SQL out!
- Query QuestDB via SQL with premium time-series extensions in real-time.
- Cost effective
- Massive throughput, minimal hardware. Trust your foundation.
The heart of your command centre
QuestDB powers Central Group's Business Control Tower
Central Group trusts QuestDB at the core of their business analytics. With time-series features like deduplication, out-of-order indexing, and handling of high cardinality data, Central Group can now monitor their growing data in real-time. All with minimal hardware creep.