NYC Taxi Data
Analytics Dashboards
Powered byQuestDB andGrafana
A real-time replay of 146,393,317 taxi rides, carrying 238,016,495 passengers across New York City in 2015.
Taxis in transit
An estimate of how many taxis were carrying passengers at this time, eight years ago today.
SELECT
  count()
FROM
  trips
WHERE
    pickup_datetime
    BETWEEN
        dateadd('h',-2,dateadd('y', 2015 - year(now()),now()))
        AND
        dateadd('y', 2015 - year(now()),now())
    AND dropoff_datetime > dateadd('y', 2015 - year(now()),now())
SAMPLE BY 2h
Passengers in transit
An estimate of how many passengers were in transit by taxi at this time eight years ago.
select sum(passenger_count) from trips
WHERE
    pickup_datetime
    BETWEEN
        dateadd('h', -2, dateadd('y', 2015 - year(now()), now()))
        AND
        dateadd('y', 2015 - year(now()), now())
    AND dropoff_datetime > dateadd('y', 2015 - year(now()), now())
SAMPLE BY 2h
Total fare today
Total fare accumulated since midnight on this day eight years ago.
SELECT
  sum(fare_amount) revenue
FROM
  trips
WHERE
  pickup_datetime BETWEEN
    dateadd('y', 2015 - year(now()), timestamp_floor('d', now()))
    AND dateadd('y', 2015 - year(now()), now())
Trips today
Total taxi fares on this calendar day eight years ago, from midnight to the current time.
SELECT
  count() trips
FROM
  trips
WHERE
  pickup_datetime BETWEEN
    dateadd('y', 2015 - year(now()), timestamp_floor('d', now()))
    AND dateadd('y', 2015 - year(now()), now())
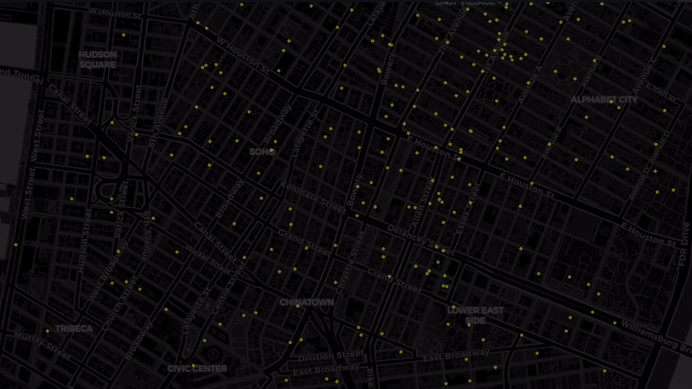
Geodata
Generate deep business insights by combining locations and timestamps.Dropoffs (last 2 min)
A heatmap of taxi dropoffs in New York City in the past two minutes, eight years ago today.
SELECT
  dropoff_datetime,
  dropoff_latitude,
  dropoff_longitude
FROM
  trips
WHERE
  pickup_datetime BETWEEN
    dateadd('h', -4, dateadd('y', 2015 - year(now()), now()))
    AND dateadd('y', 2015 - year(now()), now())
  AND dropoff_datetime BETWEEN
    dateadd('m', -2, dateadd('y', 2015 - year(now()), now()))
    AND dateadd('y', 2015 - year(now()), now())
Pickups (last 2 min)
A heatmap of taxi pickups in New York City in the last two minutes, eight years ago today.
SELECT
  pickup_datetime,
  pickup_latitude,
  pickup_longitude
FROM
  trips
WHERE
  pickup_datetime BETWEEN
    dateadd('m', -2, dateadd('y', 2015 - year(now()), now()))
    AND dateadd('y', 2015 - year(now()), now())
Insights
Discover trends in your data using modern SQL analytics.Tip / fare correlation
A scatterplot correlating tips to total fare of a NYC taxi trip. Points in purple indicate those correlating to fixed percentages of the total fare -- 10%, 15%, 20%, etc., with a 1% tolerance.
 SELECT
  tip_amount,
  fare_amount,
  (
    abs(tip_amount / fare_amount - 0.1) < 0.01
    OR abs(tip_amount / fare_amount -0.15) < 0.01
    OR abs(tip_amount / fare_amount - 0.2) < 0.01
    OR abs(tip_amount / fare_amount - 0.3) < 0.01
  ) percent_tip
FROM
  trips
WHERE
  pickup_datetime BETWEEN
    dateadd('m', -30, dateadd('y', 2015 - year(now()), now()))
    AND dateadd('y', 2015 - year(now()), now())
  AND fare_amount < 70
  AND tip_amount < 15
  AND tip_amount > 0;
Fare average
Utilising window functions to compute average taxi fares, since midnight (UTC) of today's calendar day and now (relative to eight years ago).
WITH x AS (
  SELECT
    pickup_datetime,
    avg(fare_amount) OVER (
      ROWS BETWEEN UNBOUNDED PRECEDING
      AND CURRENT ROW
    ) avgFare,
    avg(fare_amount) OVER (
      ORDER BY
        pickup_datetime RANGE BETWEEN 10 MINUTE PRECEDING
        AND CURRENT ROW
    ) avgFareHourlyMavg
  FROM trips
  WHERE
    pickup_datetime BETWEEN
        dateadd('y', 2015 - year(now()), timestamp_floor('d', now()))
        AND dateadd('y', 2015 - year(now()), now())
)
SELECT
  x.pickup_datetime,
  last(avgFare) average_fare_since_midnight,
  last(avgFareHourlyMavg) average_fare_last_last_hour
FROM x
SAMPLE BY 1m
Build your own on QuestDB
High performance ingest & slick visualizations.
Perfect for analytics.
Download QuestDB