Are headless data and headless BI the future?
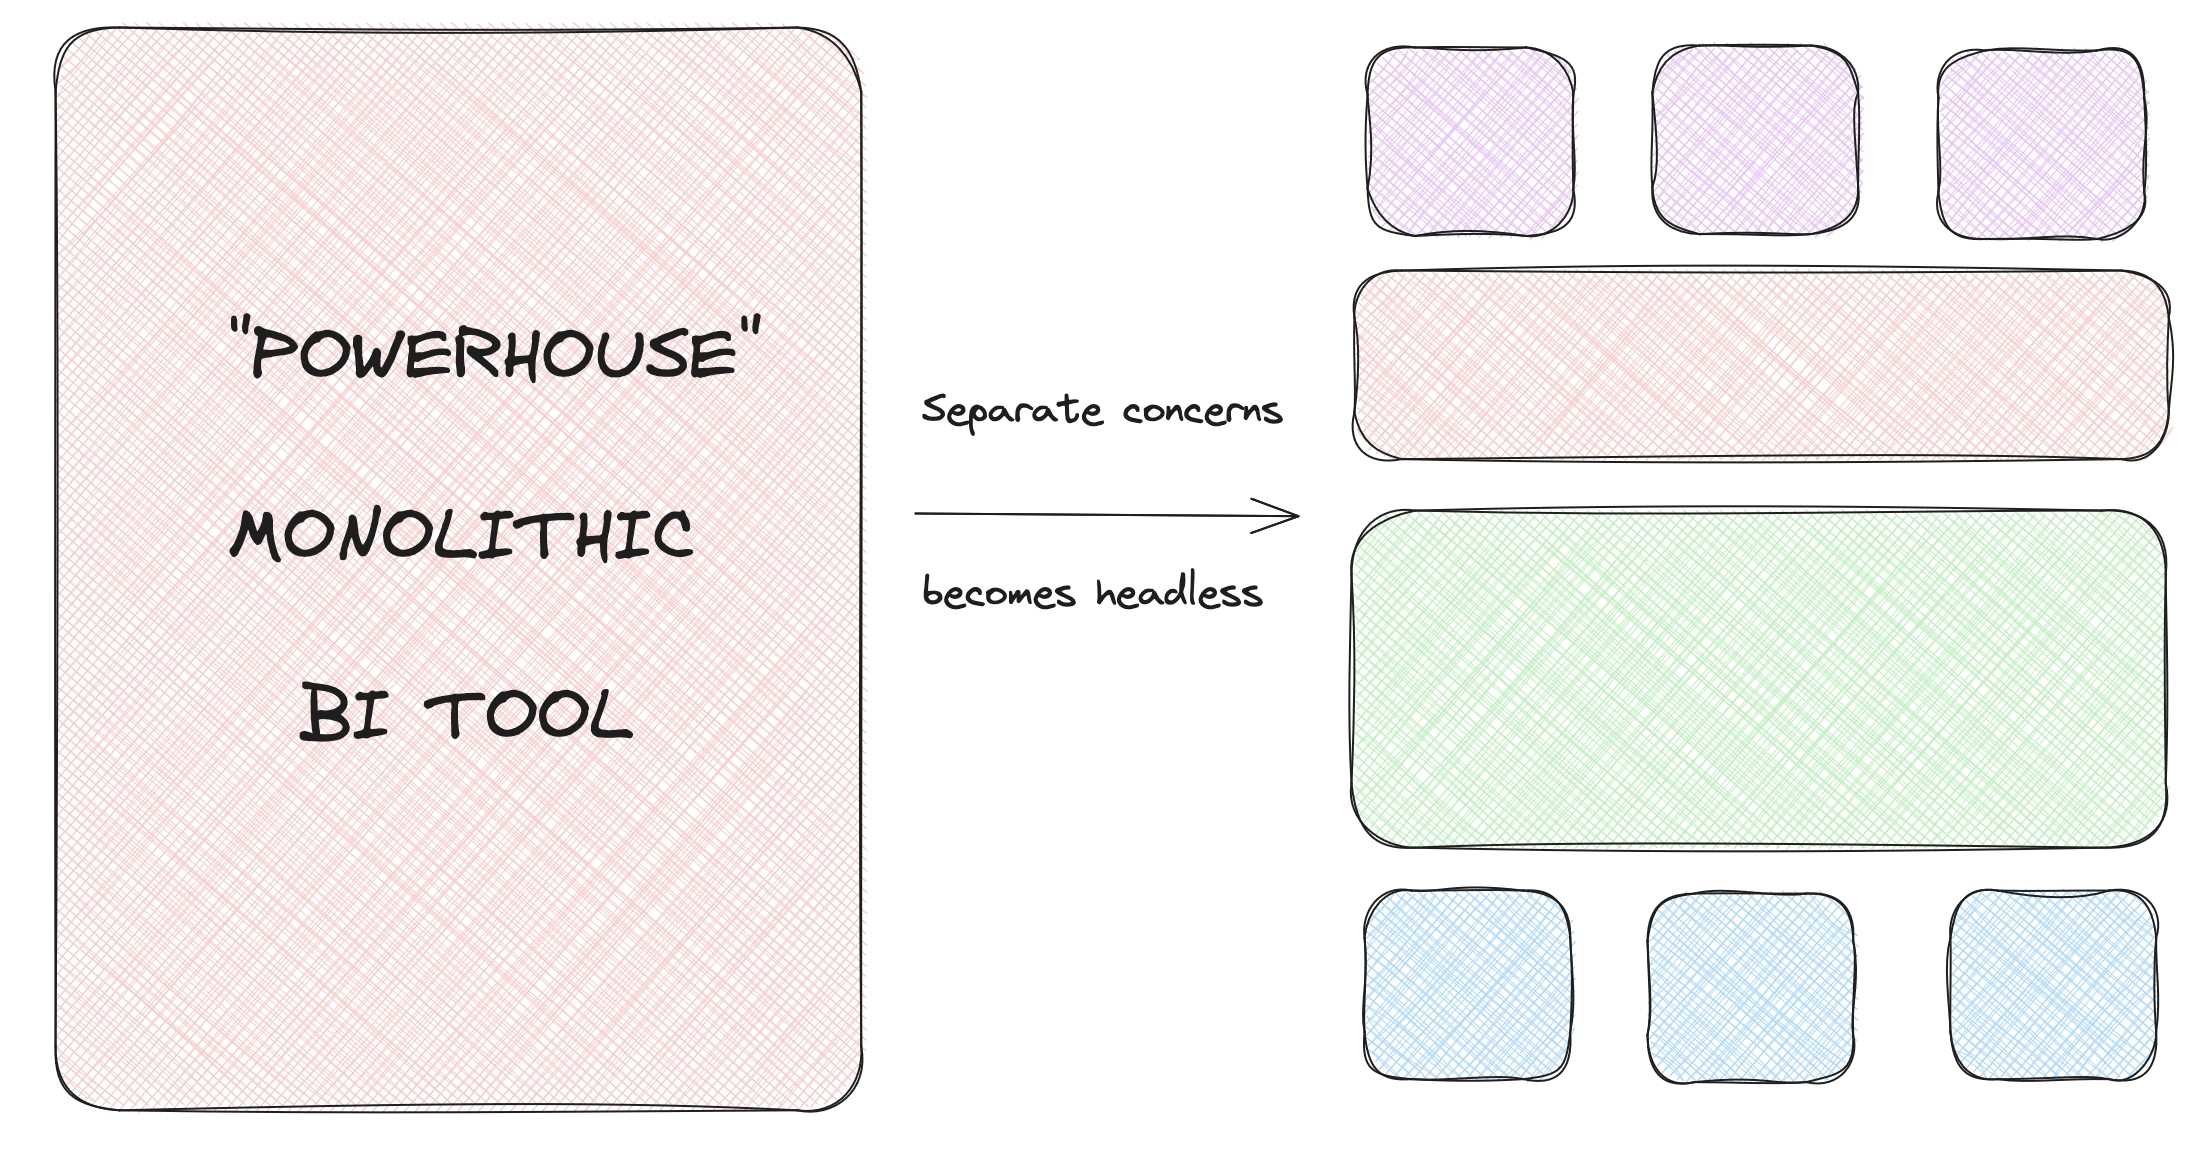
Headless data, frequently termed headless business intelligence (BI), represents a shift in the modern approach to data architecture. In short, it's a style of "separated concerns" which breaks up the various layers of the traditionally monolithic BI powerhouse tool.
But what makes it headless? The term is all the rage in certain business circles, and it can be hard to understand just what it means. We'll explain what it is, and look at how leading companies are re-approaching modern data architecture.
What is separation of concerns?
First, what does it mean to separate concerns?
Separation of concerns is an engineering principle that divides a program into sections. Each section is then responsible for a specific functionality, and its practical context is bound up into that one specific area.
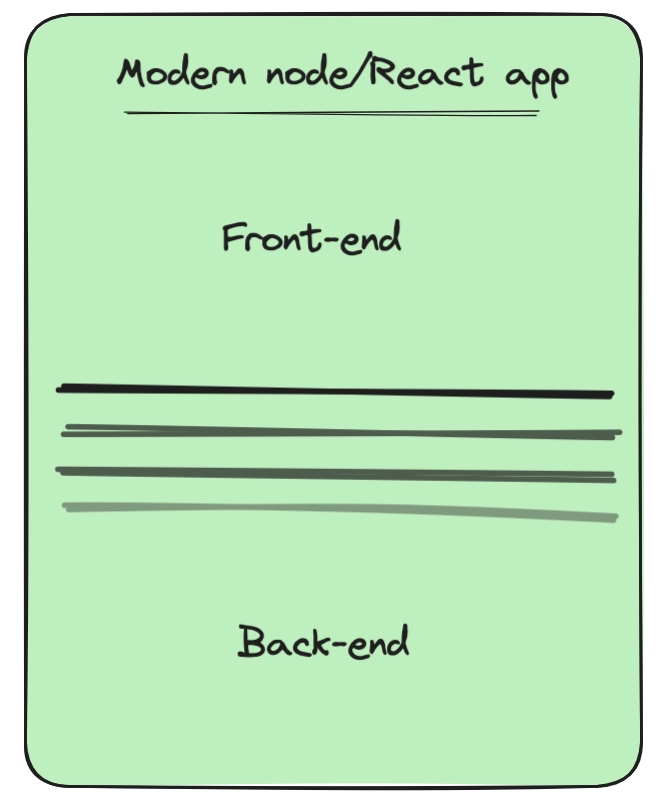
A common example is that, in a web application, the front end is separated from the back end. Even if it might "all be JavaScript" and even if the lines are fairly blurry, it's a point from which to organize both technically and philosophically.
Separation of concerns reduces the risk of unintended side effects when changes are made. It also leads to the independent scale of different system components and different dialects to understand them. It's easier to develop, test, and build organizations around separated concerns.
Back to business!
What is business intelligence?
Now, what's business intelligence?
Business Intelligence (BI) refers to the technologies, processes, and practices used to collect, integrate, analyze, and present business data to help organizations make informed decisions. BI systems gather data from various sources, process it, and then present it in a way that is easy to understand, often through dashboards, reports, charts, and other visualizations.
If you've heard companies talk about their internal data, this is probably referring to business intelligence. If it's a byproduct of, say, your sales pipeline, purchases, revenue forecasts, web traffic in aggregate, subscriber growth, and so on, then that's intelligence that's useful for your business.
If your servers generate it and it's useful for engineers and machines, that's more "system metrics".
How does headless data differ from traditional BI?
Put in simple terms, "headless" means data without an active logic or presentation layer. Traditional BI tools were designed with monolithic architectures, where data ingestion, definition, and visualization occurred within a single platform. They have a head (visualizations, utilities), a body (data and such), and several rather beefy appendages (widgets and doodads).
Early leaders in the space made promises such as this: "Send your data to our powerful BI tool, and it just works - reports, dashboards, machine-learning...".
But alas, this is not so and the marketing, as it does, clouded the reality. Aggregation - let alone presentation and analysis - across many contexts is very, very hard to do. As such, traditional, monolithic BI tools cannot keep up with today's scale. The need for a new approach became clear. Enter headless BI.
What makes traditional BI hard to scale?
When connecting a database, third-party applications, and other streams to a single entity for processing, there are many deep technical challenges. On its own, this ingress is very difficult. To then also offer to solve access control, visualization, machine learning, and other tasks is a tall order.
Data disparity across sources
To start, the data you get from these disparate sources will be very different. There is no standard format shared across all components. The result is duplicate and inconsistent data. A customer notion in one tool may be entirely different from another. Yet the BI tool is charged to make sense of the ingress, organize it, present it, and do so to match today's performance expectations.
Defensive and rapidly changing third-party API
Secondly, connector/integration ecosystems are extremely difficult to maintain. One clear example is that third-party APIs are often gated defensively so that one BI tool cannot dominate the market. These are often marketed as "one-click" integrations. But that is seldom so.
For instance, if you're Atlassian, makers of JIRA, Confluence, and other tools, do you want it very easy for your APIs to export data to rival BI tools? Or is Atlassian incentivized to defend their ecosystem to then eventually develop their own lucrative BI tools? The answer is the latter.
Furthermore, APIs can change without warning. A team may build a connector based on one third-party API spec, only to have it change with no warning, breaking the connector for customers. If the software of the BI tool is packaged, it may be weeks before an update is possible.
Growth beyond spreadsheets
Monolithic BI tool designs were effective at first, when working primarily from spreadsheets. These were very structured, and often in common contexts like finance. But as teams grew beyond sheets and into various data formats, these systems struggled to keep pace with the distributed, multi-tool environments of modern organizations.
Both because of interfacing with many APIs, and also handling the massive, growing scale these endpoints and their lack of uniformity create. As a result, dashboards are often incomplete and very slow, if they can scale to meet the demand at all.
In response, headless BI guides towards a separation of concerns, so that each "layer" can be designed to match the organization's needs and thus be handled with the greatest effectiveness. This often puts several tools in place of one.
The heart of headless data
Central to the "headless" prospect is addressing the core problem: messy data from different, rapidly growing data sources. To solve this, the first step is to organize a clean and scalable data layer. Before diving deeper, it's important to clarify that 'headless' is a somewhat unusual term for this approach.
As we create a better central source of intelligence, akin to creating a central "brain", we'd assume there's a head to store that brain. Indeed, "headless" approaches move "the brain" from "the head", while considering "the head" as representative of visual or consumptive components like dashboards or ML processing.
As such it evokes strange imagery, such as the baffling Krang from Ninja Turtles, with brain-in-stomach, though without its head:

But we'll bypass that quirk. Going forward, "headless" simply describes separated concerns.
Decoupled data layer
At the heart of headless BI is the decoupled data layer, a centralized, shared repository where data is sent for storage and querying. This approach eliminates the redundancy and inconsistency seen in traditional BI tools, where data is often redefined across multiple reports and dashboards depending on their origin and result. What does a better approach look like?
Picture a JSON object shared across all systems which generate useful metric data. If every entity adheres to a schema, managing and understanding the data becomes much easier:
{"event": {"id": "1234567890abcdef","type": "transaction","category": "ecommerce","action": "purchase","timestamp": "2024-08-19T12:34:56.789Z"},"user": {"id": "user-001","email": "user@example.com","full_name": "John Doe","role": "customer"},"customer": {"id": "cust-001","name": "Acme Corp","type": "business","status": "active","created_at": "2023-01-15T08:30:00.000Z"},"product": {"id": "prod-001","name": "Widget A","category": "widgets","price": 29.99,"currency": "USD","quantity": 3},"transaction": {"id": "trans-001","total": 89.97,"currency": "USD","payment_method": "credit_card","status": "completed","timestamp": "2024-08-19T12:34:56.789Z"},"source": {"app": "shopping_cart","version": "2.5.1","host": "web-server-01","ip_address": "192.168.1.10"},"geo": {"location": {"lat": 37.7749,"lon": -122.4194},"country": "US","region": "CA","city": "San Francisco"}}
This way, we won't have different keys representing customer records:
customer_record, customer, user_record, and so on. Instead, we'll have a
shared customer object. And every tool, when sending data into the data layer,
will use this schema. It is much easier to understand and visualize upstream.
Security & access control
Security follows logically from a centralized organizational understanding of your "data schema". For large organizations, compliance for data-handling and access restrictions is of vital, often legally relevant, significance. A single schema for your data enables clean access control.
Consider an array within your shared objects like so:
{...,"access": ["executive", "consultant"],}
Now, if you're building a dashboard, app, or what have you, limiting access to certain array values takes care of permissions. Access is one clear example of the benefits of a centralized schema. As a primitive in the shared schema, from initial generation to consumption, the declared "role" or perhaps "access" level is clear throughout the entire path.
Consider in the context of GDPR. A boolean key could indicate what is "personally identifying information", and the team can ultimately restrict upstream whether certain "heads" may consume it or not:
{...,"personal_information": true,}
API-driven data access
Instead of a monolith with likely opaque operation, the headless apparatus is
many parts stitched together via APIs. If you maintain an app or system within
the organization that generates useful data, POST your schema-adhering results
to a centralized end-point.
This means that the core of a headless BI setup is likely a powerful database or robust ingress infrastructure:
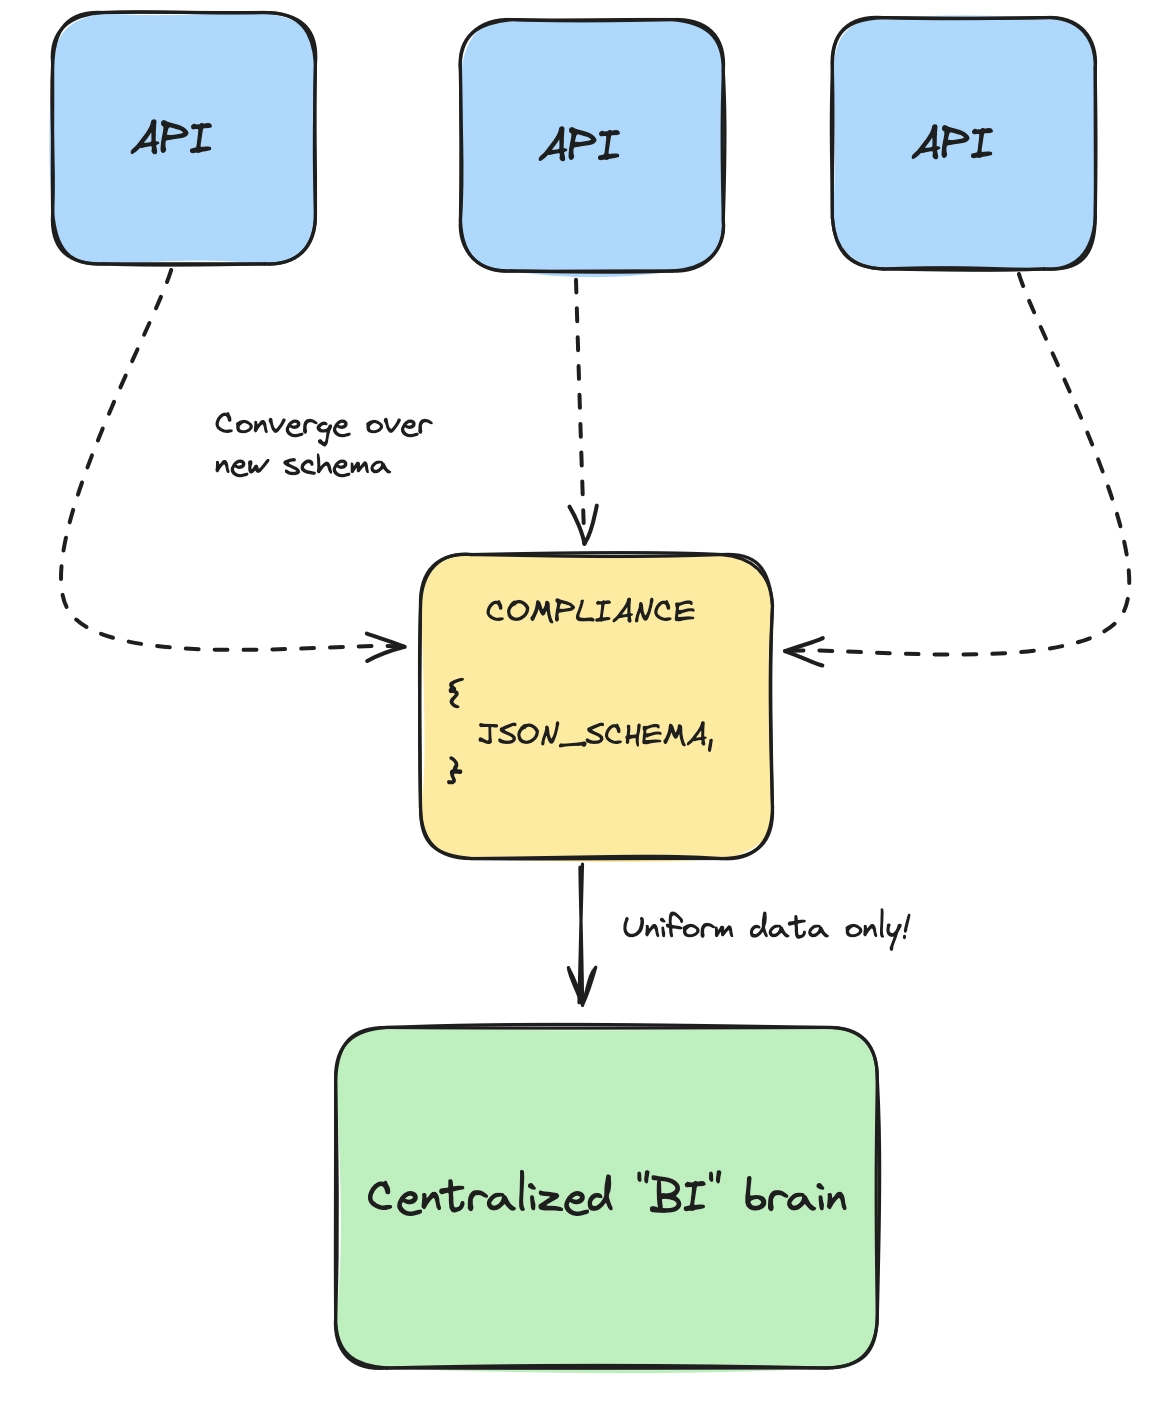
A time-series database like QuestDB that can handle massive scale of time-bound data, a search engine like Elasticsearch with strong data retrieval primitives, or something similar, are candidates to act as this brain. At very large scale, it may be several things working together.
But the key is that it is centralized and receives and enforces adherence to the schema which defines your organization's data stream. The entity must scale well, and respond to precise queries with speed and accuracy.
Attaching the "heads"
Now that we have a centralized data layer, we can build our "heads" on top of it. Scalability is a key consideration. As such, the "heads" often connect to a caching layer.
To prevent your data layer from being overloaded, the consuming "heads" will hit the cache. If the result exists, the cached response is returned. If not, the caching layer will query the "brain", store the result, and return it to the requesting "head":
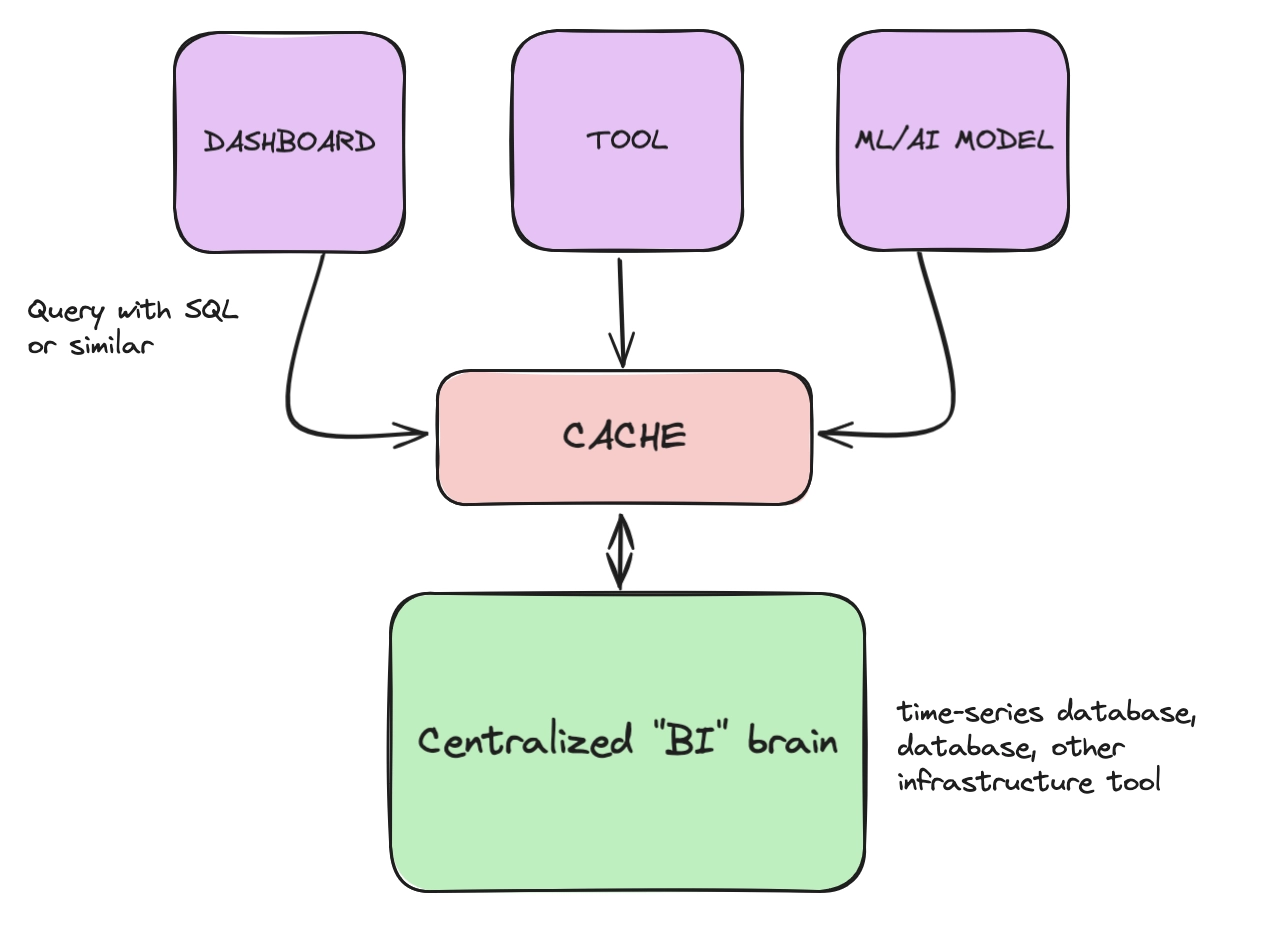
New dashboards, tools, and so on, can now trust that your business applications send appropriately specced data to the "brain", and that they can receive data in a timely manner. Now adding a "new head" is a matter of sending a query to your "brain", supported by a helpful caching layer.
In optimal setups, the organization will apply a common query language the heads use to retrieve data, such as SQL. Now, using this query language, anyone can ask the "brain" for data. Teams can share key queries. Both socially and technically, it's more simple.
And so, we've busted up the "monolith" in favour of separated concerns. While we could tell the "headless" story with a greater deal of stratification, ultimately we have split the "brain", the data-layer and its data organization and ingress, from the "heads", the visualizations and post-analysis tools. This is essentially "headless" BI infrastructure.
Summary
The adoption of headless BI is not only a technical upgrade. It represents a strategic shift in how organizations approach data collection and proliferation. By decoupling the data layer from the presentation layer, organizations receive better composability of their essential data infrastructure. There can be more precise selection of tools to accommodate internal needs. And there is no reliance on one, massive BI platform and no pressure to vendor-lock.
It's very clear and logical, and likely how most engineering teams would create such an apparatus from the get-go. However, the contrast from the existing monolithic tools is what requires us to adjust our understanding and lay things out. Even though it's a confusing term, as it puts the location of the "brain" into question, the entire practice of separating BI-related concerns to a more flexible data layer, makes modern data infrastructure "headless".