A low-code bitcoin ticker built with QuestDB and n8n.io
We've had many predictions of the emerging trends of 2020. Three that ended up ringing very true were the popularity of low-code platforms, the rise of time-series databases, and a digital currency boom. This tutorial combines these three topics into one example workflow automation that stores and analyzes Bitcoin market prices in QuestDB with a workflow template to get up and running quickly.
Prerequisites
This tutorial will use the docker images for both QuestDB and n8n.io so users should ensure that they have the following installed and running on their system:
Confirm that this is correctly set up by requesting the version number:
docker --versionDocker version 20.10.2, build 2291f61
What is a low-code platform
low-code platforms allow for building applications without having to dig deep into code or technical implementation details. Most of the tools in this category use a visual editor and have drag-and-drop features to allow for quickly building systems that would otherwise require more intensive development resources. The main benefits are for users who either lack professional programming experience or don't want to invest time building applications from the ground up and manage rapidly-changing compatibility issues.
A great platform that I've been using recently is n8n.io, which offers a creative and efficient visual editor for process automation. Over 200 integrations supported out-of-the-box means you have a lot to choose from if you want to start streaming data into QuestDB from the supported nodes quickly.
This tutorial demonstrates how to use an n8n.io workflow that queries Bitcoin market prices via a REST API and uses QuestDB as a data store for the market prices as time series data.
Setup steps
The first step will be to get n8n.io up and running using docker:
docker run -it --rm \--name n8n \-p 5678:5678 \-v ~/.n8n:/home/node/.n8n \n8nio/n8n
This command mounts a volume with -v so that user configurations will be saved
at ~/.n8n. QuestDB can be started with the following docker command:
docker run -p 9000:9000 -p 8812:8812 --name questdb-n8n questdb/questdb
By giving the container a name with --name questdb, we have an easy way to
refer to the container created by run later on. If we want to re-use the same
container (and its data!) after it has been stopped, we can use the following
commands:
# bring the container updocker start questdb-n8n# shut the container downdocker stop questdb-n8n
Import an example workflow
To get started with our example workflow, navigate to http://localhost:5678/. In the left menu, click the greater-than icon > to expand the menu and reveal a navigation panel. To help us along with the setup steps, we have a template that can be imported directly from a URL.
Select Workflows -> import from URL and paste the following URL:
https://questdb-docs.s3-eu-west-1.amazonaws.com/QuestDB_BTC_Ticker.json
If imported successfully, the workflow will be generated automatically in the editor window:
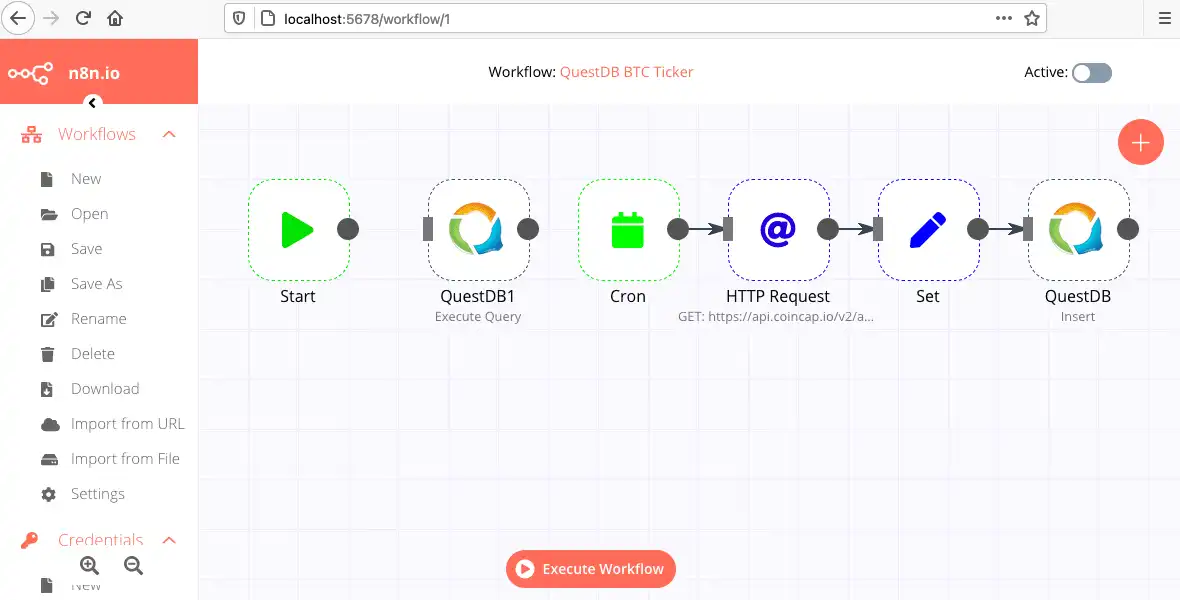
Each of the nodes with their configuration can be inspected at any time by double-clicking and inspecting the Parameters and Settings panel. From left-to-right we have the following objects:
- QuestDB node which executes an SQL statement to create our
btctable - cron node which is set to a 1 minute interval
- HTTP Request node which makes a
GETrequest to a public API with latest BTC value in USD - Set node which selects the fields we are interested in from the HTTP response and assigns them the correct type
- QuestDB node which inserts incoming values from the Set node into a
btctable
Connecting to QuestDB
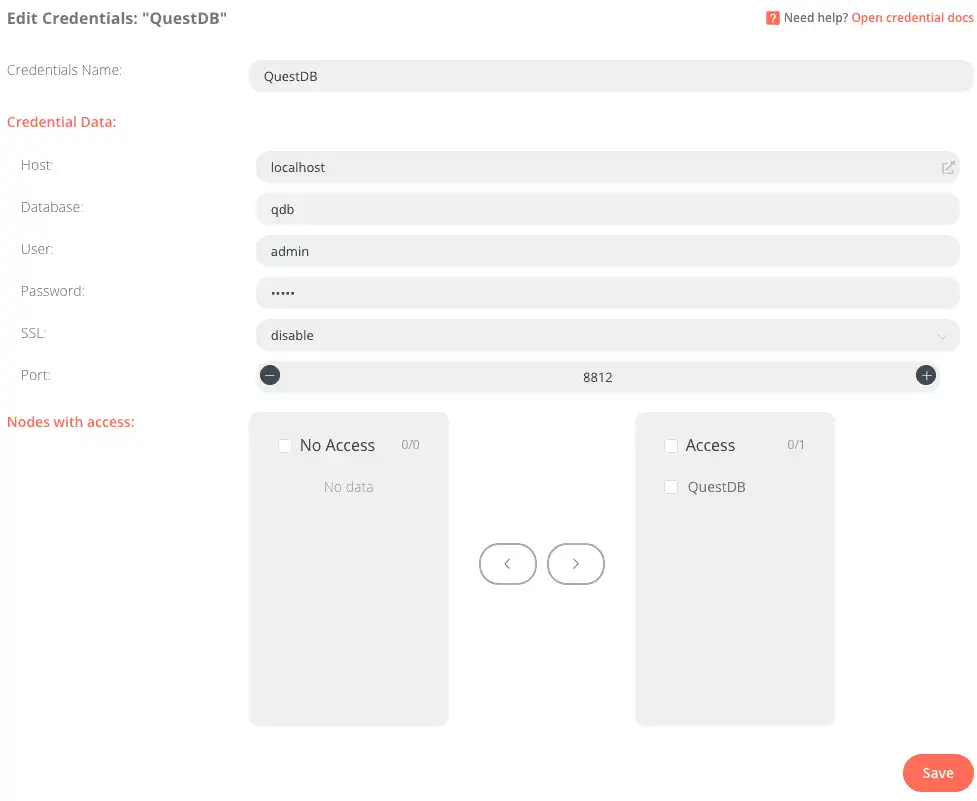
Before we activate the workflow, we have to provide connection credentials to QuestDB. In the left navigation menu, select Credentials -> New and choose type QuestDB.
The default configuration provides most of the information we need for a QuestDB instances running locally, but we will need to allow the QuestDB node access to these credentials in the Nodes with access section.
When correctly set up, the credentials configuration should look like the following:
Activating the workflow
To check if the workflow is correctly configured, click the Execute Node
button on the first QuestDB node. On success, we should have a new table btc
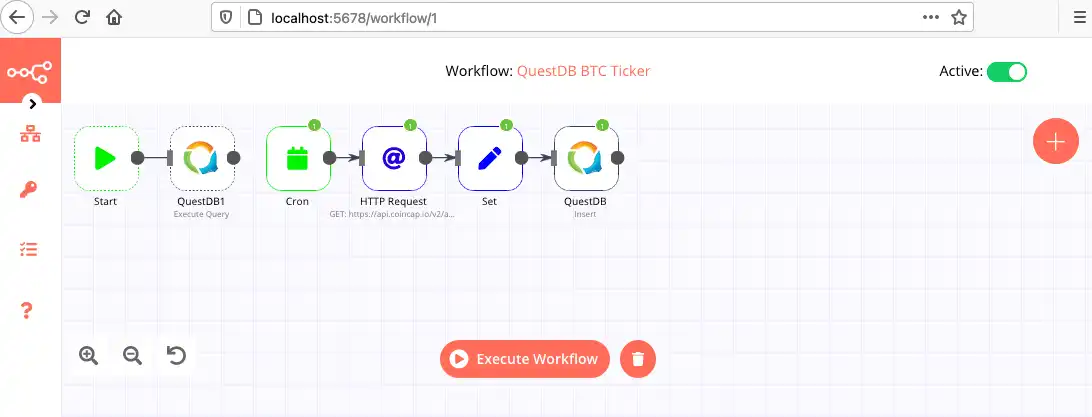
with a Timestamp and price column. Activating the workflow with the toggle
in the top-right of the workflow editor will prompt you to save the workflow if
you have not done so already. Give the workflow the name QuestDB BTC Ticker
and click Save. If everything is set up correctly, we will have a success
indicator on each of the nodes which are passing as expected and a notification
window will display the status of the workflow:
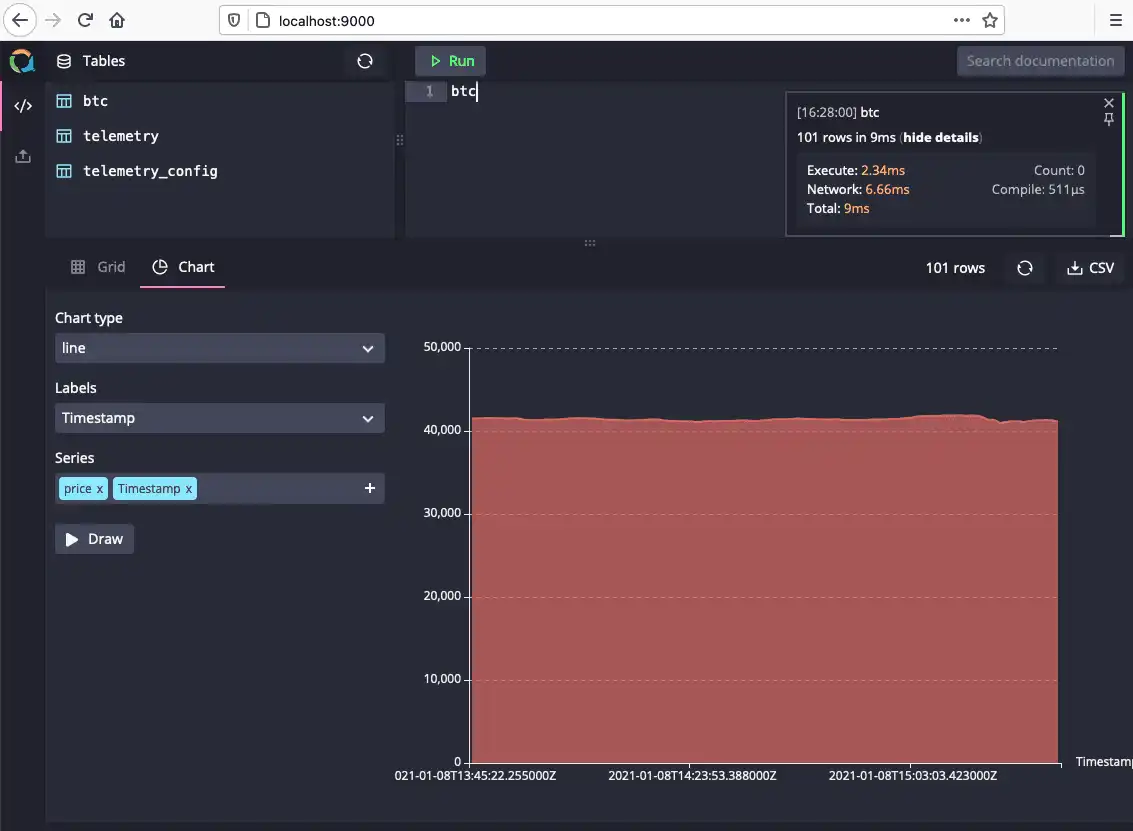
We can confirm that we are writing data to QuestDB by navigating to
http://localhost:9000. The btc table is visible in
the top-left Tables panel and we can query incoming requests by simply
adding btc to the query editor and selecting Run. The data will be
returned as a table by default, but can easily be graphed by selecting the
Chart button and specifying price as the series to visualize:
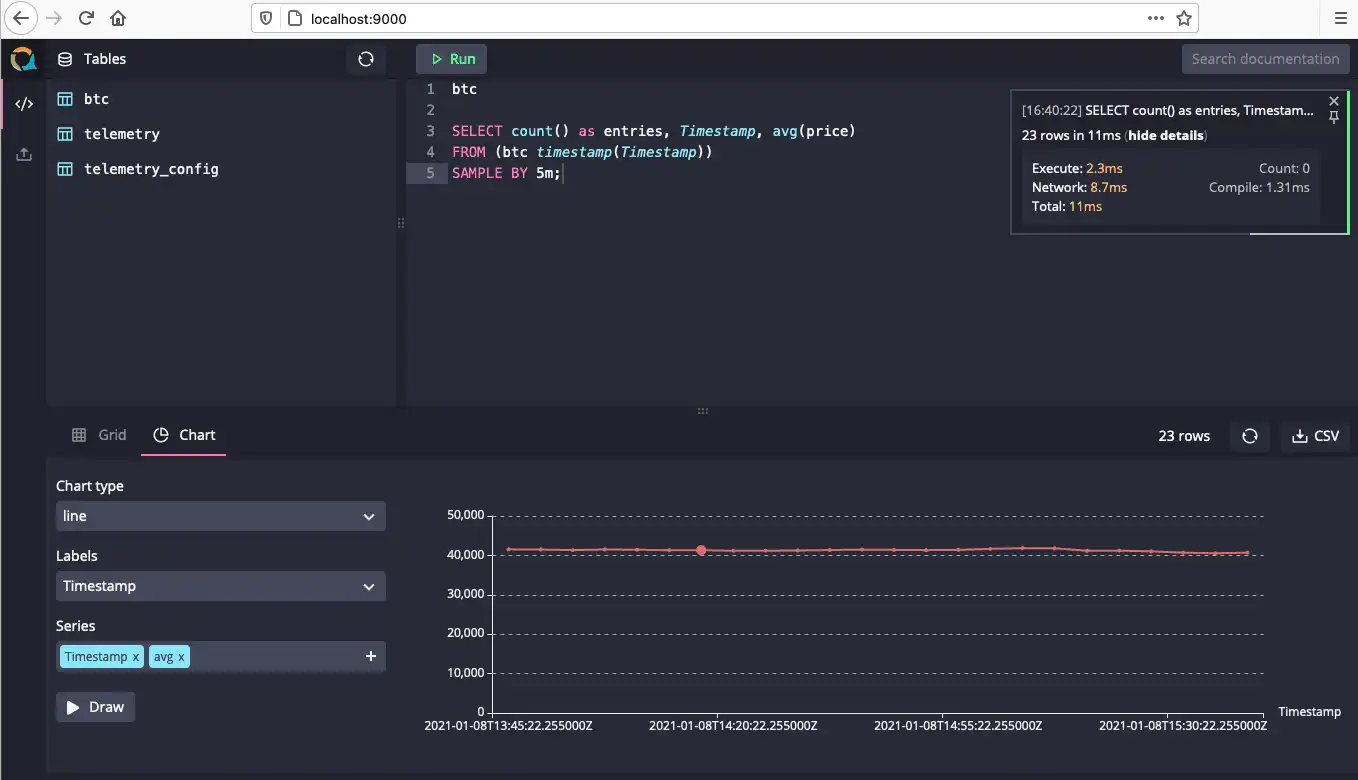
We can create some aggregate queries if we require specific data points or charts. The following SQL query allows for 5 minute aggregates of our incoming BTC pricing data:
SELECT count() as entries, Timestamp, avg(price)
FROM (btc timestamp(Timestamp))
SAMPLE BY 5m;
Next steps
In this article, we've covered how to get started with n8n.io, a low-code workflow automation platform to query a public REST API, stream data into QuestDB, and build some simple data visualizations with QuestDB's built-in charting functionality. Our example uses minimal information we need from the REST API, so future changes could be to have more fields or currencies being inserted into QuestDB to make more interesting comparisons across multiple tables. We are also using the cron node with an interval of 1 minute, so improvements would be to use a node that can provide much higher rates of ingestion to leverage the performance benefits of QuestDB.
For inspiration and troubleshooting workflow automations using n8n, take a look at the n8n community forum. If you like this content, we'd love to know your thoughts! Feel free to share your feedback or just come and say hello in the community forums.