Using Telegraf and QuestDB to store metrics in a time series database
This tutorial is written by Gábor Boros, who has put together some great examples of using Telegraf as a means of collecting and sending system metrics as time series data to QuestDB for analysis and visualization.
Thanks Gábor for the awesome contribution!
Introduction
Telegraf is a plugin-driven server agent for collecting, processing, aggregating, and writing metrics. With more than 200 plugins, it can collect almost any kind of data about the server it is running on, application data or even filesystem changes.
Although Telegraf can collect an exceptional amount and variety of data, we need to store and visualize this information at some point. Considering that we collect the metrics over time, a convenient way to store time series data is using a time series database. We'll use QuestDB for ingestion and perform some basic visualization for this tutorial.
Multiple telegraf clients and out-of-order data
When you use multiple clients, it can happen that data coming from various sources simultaneously can arrive out-of-order by time. QuestDB used to have the downside of dropping this kind of out-of-order data. The QuestDB team solved this as of the 6.0 release, meaning there is no need to apply any workarounds like sorting data ourselves before inserting.
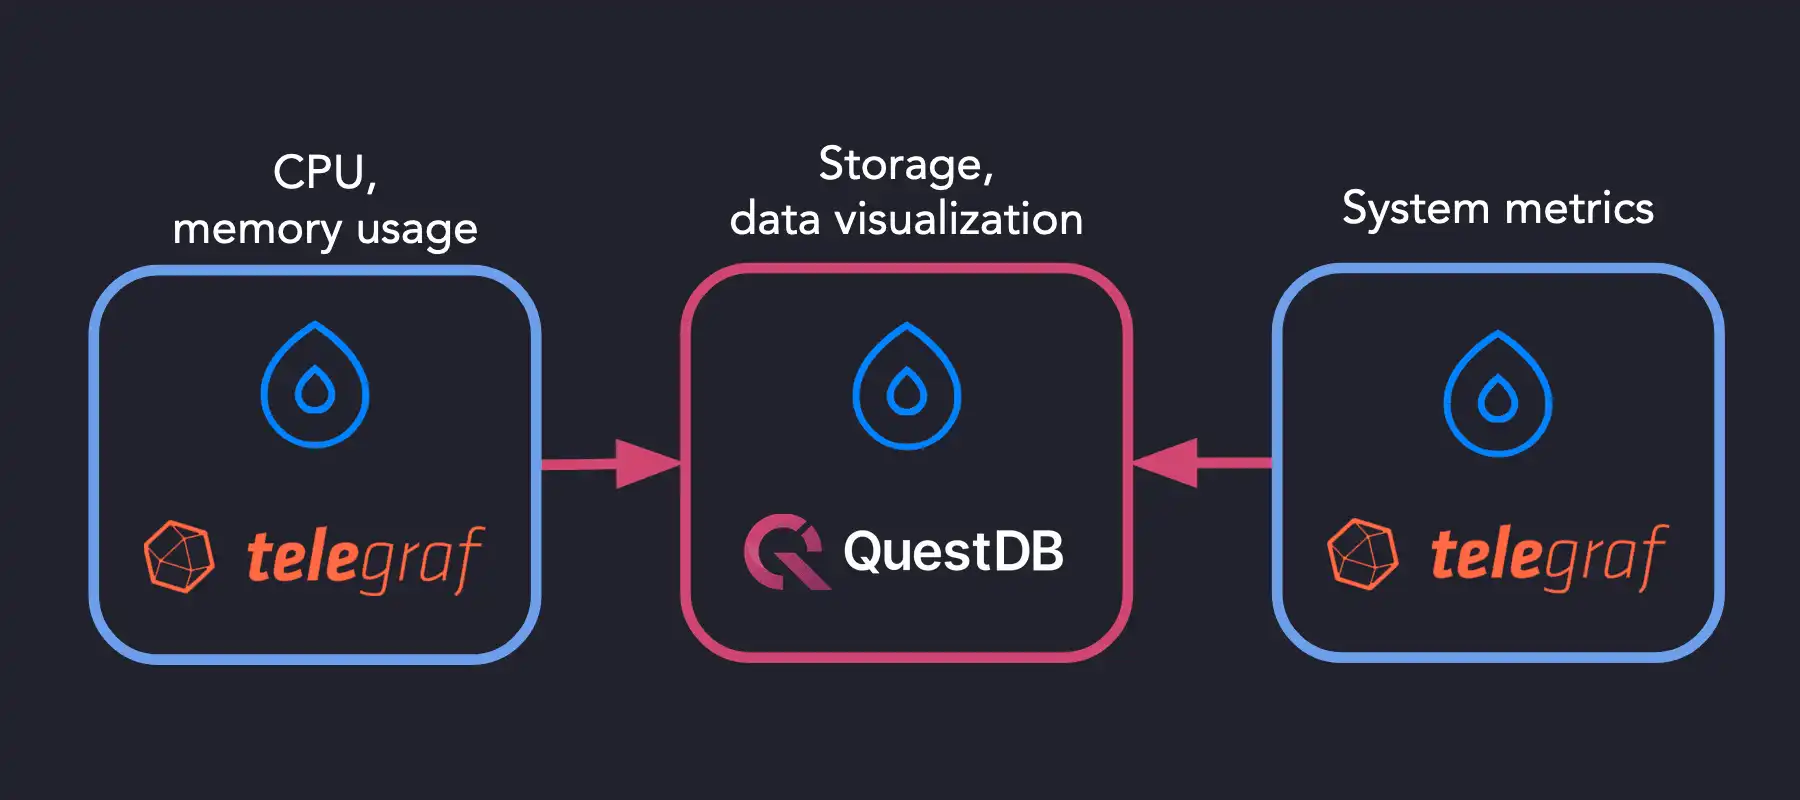
This tutorial will set up multiple virtual machines, install Telegraf, QuestDB and experiment with how we can visualize the incoming data about server status (load, CPU, swap, and memory usage) over time.
Celebrating the recent public market debut of DigitalOcean and QuestDB's marketplace offering, we are going to join the celebration. Therefore, we will need the following resources for the tutorial:
- A DigitalOcean account (get 100 USD credit for free by signing up using the QuestDB referral link)
- Basic
shellknowledge - Basic knowledge of
vimornano
Enough talking, let's jump right in and create our Droplets!
Setting up DigitalOcean droplets
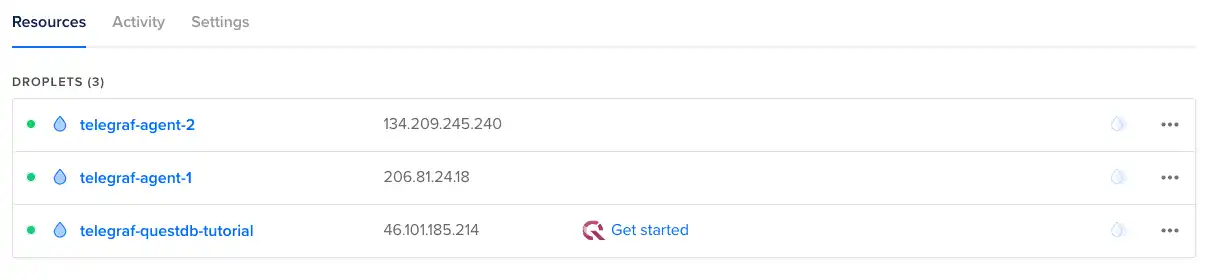
In total for this tutorial, we will create three droplets on DigitalOcean. Afterwards, we will have the following resources:
- 1 x QuestDB Droplet for storing and visualizing metrics.
- 2 x Droplets running the Telegraf agent collecting system metrics.
Create a QuestDB Droplet
Let's get started with the database Droplet. DigitalOcean has an excellent marketplace with 1-Click Apps reviewed by its staff. QuestDB is available on the marketplace recently, so the setup takes about 30 seconds:
- Navigate to the marketplace listing
- Click on Create QuestDB Droplet
- Select the basic plan for your Droplet (4GB RAM is recommended)
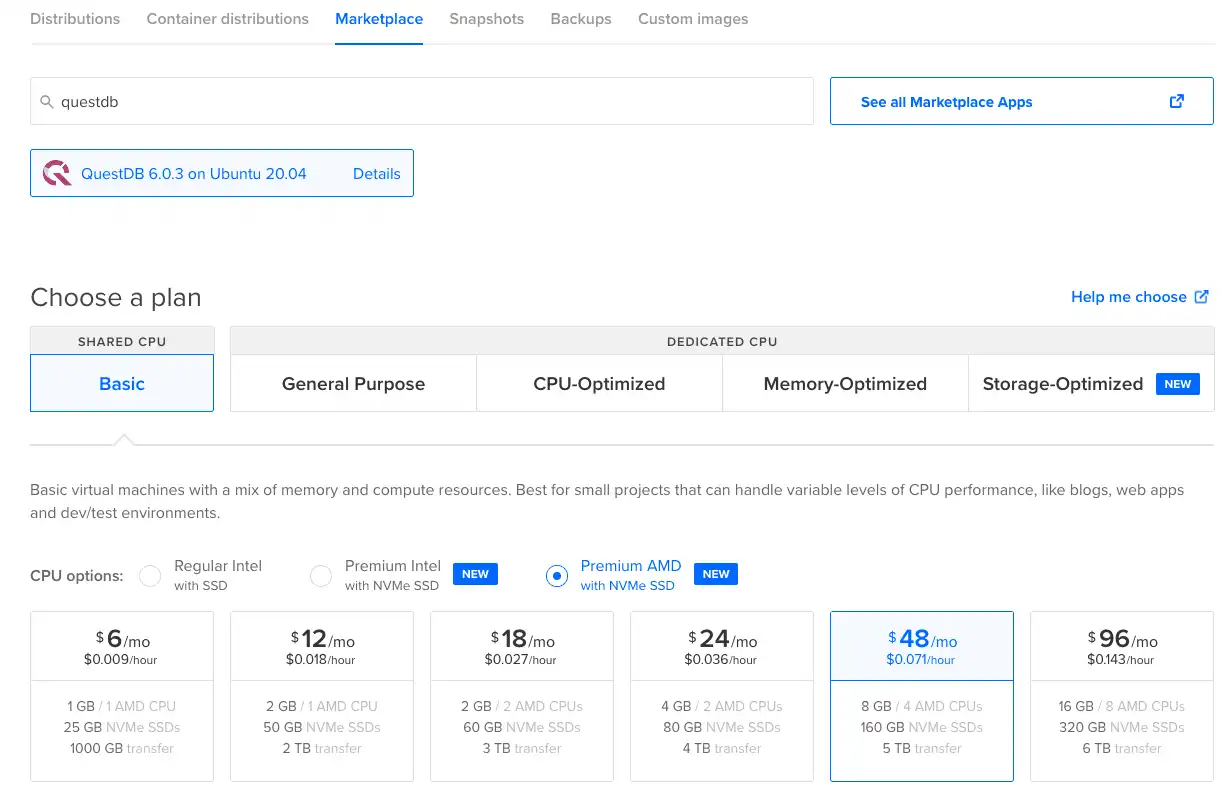
- Choose a region closest to you
- At the Authentication section, enter your SSH public key, or set a password
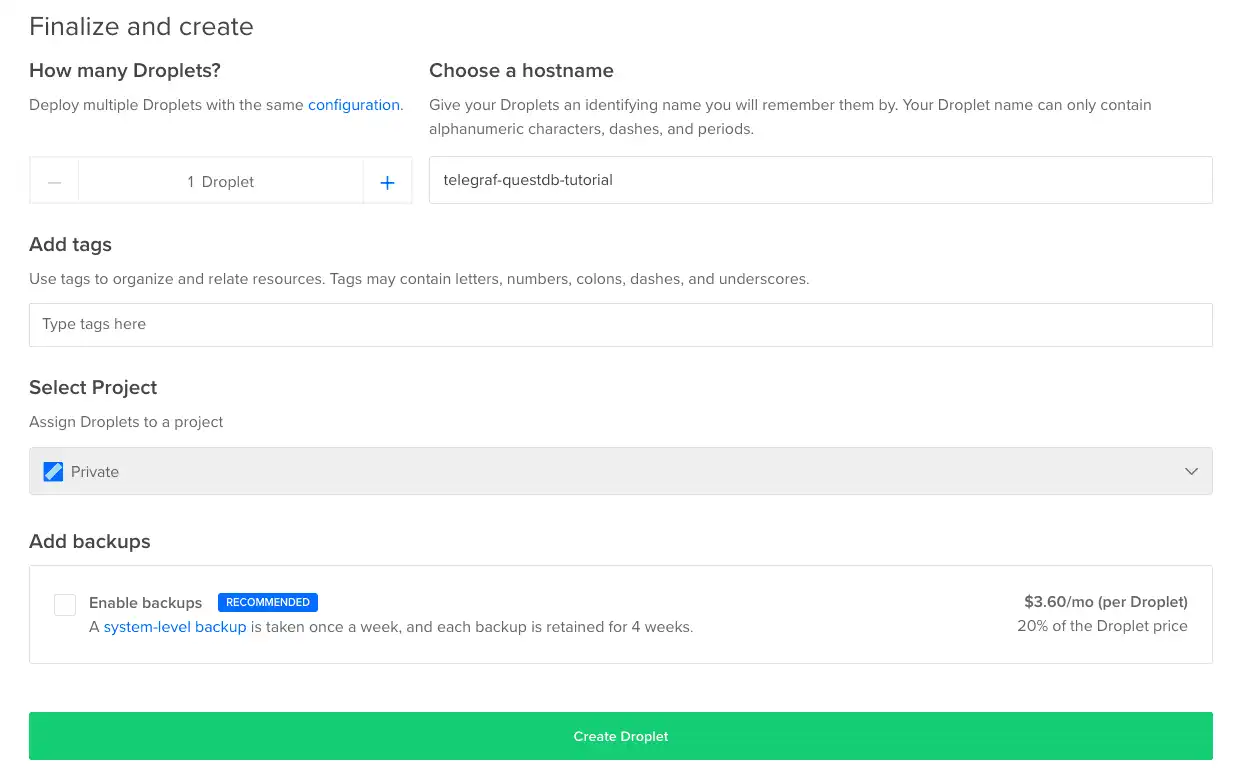
- Set the hostname to
telegraf-questdb-tutorial - Leave all other settings with their defaults, and click Create Droplet at the bottom of the page
In about 30 seconds, QuestDB is ready to use. To validate that we set everything
up successfully, copy the Droplet's IP address by clicking on it and navigate to
http://<IP ADDRESS>:9000/ where <IP ADDRESS> is the IP address you just
copied. The interactive console should load and we can start querying the
database and inserting data!
Create DigitalOcean Droplets with Telegraf agent
We don't have any data in the database to query yet, so the next steps are to send some metrics to QuestDB for inspection. Scripts that create dummy data are always good to get started, but in this case, let's use some actual data collected on demo machines, so we have proper metrics to play with instead of synthetic data. From the QuestDB docs:
QuestDB exposes a reader for InfluxDB line protocol which allows using QuestDB as a drop-in replacement for InfluxDB and other systems which implement this protocol. – questdb.io
We will utilize InfluxDB line protocol to send data via Telegraf to QuestDB directly. The next step is to create some Droplets, start Telegraf agents, and point them to QuestDB. Create the Droplets following these steps:
- Navigate to the Droplets dashboard
- In the top-right section of the page, click Create and select Droplets
- At the "Choose an image" section, select
Ubuntu(20.04 LTS x64at the time of writing) - Select the Basic plan for your Droplet and the minimum resource type
- Choose a region of your choice that is the closest to you
- At the "Authentication" section, select your SSH key or set a password for the Droplet's root account
- Set the number of Droplets to 2
- Set the hostname to
telegraf-agent-1andtelegraf-agent-2 - Leave all other settings with their defaults, and click "Create Droplet" at the bottom of the page
Compared to the previous Droplet creation, DigitalOcean will create two Droplets instead of one. In a few seconds, the Droplets are ready to start up the Telegraf agent.
Configuring Telegraf agents to send metrics to QuestDB
In this section, we will install the Telegraf agent on all three Droplets. We can collect the system metrics from two DigitalOcean droplets that are remote, and we will send the local metrics of the QuestDB droplet's host into the database itself. To install Telegraf, we will follow the official installation method.
Installing Telegraf on the QuestDB Droplet
First of all, log in to telegraf-questdb-tutorial Droplet by executing
ssh root@<IP ADDRESS> where <IP ADDRESS> is the Droplet's IP address. Then,
on the server, run the following to make the Telegraf client available for
installation.
# Download the signing keys from influxdata.comcurl -s https://repos.influxdata.com/influxdb.key | apt-key add -# Source release informationsource /etc/lsb-release# Add influxdata.com APT repository to the APT repository listecho "deb https://repos.influxdata.com/${DISTRIB_ID,,} ${DISTRIB_CODENAME} stable" | tee /etc/apt/sources.list.d/influxdb.list# Fetch available repositories and read package listsapt-get update
We are running the above commands to add the APT repository to our list of
available repositories. Now, we can install the agent as we would do with any
packages by executing apt-get install -y telegraf. The agent is installed but
not configured yet. To configure it, let's create a new configuration file at
/etc/telegraf/telegraf.d/questdb.conf with the following content:
# Configuration for Telegraf agent[agent]## Default data collection interval for all inputsinterval = "5s"# Write results to QuestDB[[outputs.socket_writer]]# Write metrics to a local QuestDB instance over TCPaddress = "tcp://127.0.0.1:9009"# Read metrics about CPU usage[[inputs.cpu]]# Read metrics about memory usage[[inputs.mem]]# Read system statistics, like load on the server[[inputs.system]]
After saving the configuration file, we have one thing left to do: restart
Telegraf by running systemctl restart telegraf. In 5 seconds, the agent will
start reporting to QuestDB.
Installing Telegraf on demo Droplets
Lastly, install Telegraf on the remaining Droplets. As you may expect, we have
to perform the same process as the QuestDB droplet. SSH into both Droplets,
telegraf-agent-1 and telegraf-agent-2.
Add the necessary signing keys and prepare the local APT repository list:
# Download the signing keys from influxdata.comcurl -s https://repos.influxdata.com/influxdb.key | apt-key add -# Source release informationsource /etc/lsb-release# Add influxdata.com APT repository to the APT repository listecho "deb https://repos.influxdata.com/${DISTRIB_ID,,} ${DISTRIB_CODENAME} stable" | tee /etc/apt/sources.list.d/influxdb.list# Fetch available repositories and read package listsapt-get update
Install Telegraf by executing apt-get install -y telegraf and edit the
configuration file /etc/telegraf/telegraf.d/reporter.conf as the following:
Note that below, we set the socket_writer address in the configuration to
<QUESTDB IP ADDRESS>, which is the IP address of the QuestDB Droplet.
# Configuration for Telegraf agent[agent]## Default data collection interval for all inputsinterval = "5s"# Write results to QuestDB[[outputs.socket_writer]]# Write metrics to a local QuestDB instance over TCPaddress = "tcp://<QUESTDB IP ADDRESS>:9009"# Read metrics about CPU usage[[inputs.cpu]]# Read metrics about memory usage[[inputs.mem]]# Read system statistics, like load on the server[[inputs.system]]
Restart the Telegraf agents with systemctl restart telegraf just like the
QuestDB Droplet; in a few seconds, the agents will start reporting to our
database.
Run SQL queries on Telegraf metrics
At this point, we have every component set up and running to visualize some
incoming data. Navigate to http://<QUESTDB IP ADDRESS>:9000 where the
<QUESTDB IP ADDRESS> is the IP address of your QuestDB droplet, and write the
following SQL statement in the SQL editor:
SELECT * FROM cpu
This will return all data in the table for CPU metrics sent by Telegraf. We can easily create some aggregates like the average CPU usage per machine:
SELECThost,avg(usage_system) cpu_average,timestampFROM cpu
If we want to perform some more complex queries, we can perform JOINs across the three tables:
SELECTcpu.host,avg(mem.used_percent) mem_usage_average,avg(cpu.usage_system) cpu_average,avg(system.load1) load1_average,cpu.timestamp as timestampFROM cpuINNER JOIN mem ON mem.host = cpu.hostINNER JOIN system ON system.host = cpu.hostSAMPLE BY 5mORDER BY timestamp DESC
And to visualize this data, query memory usage using the following SQL:
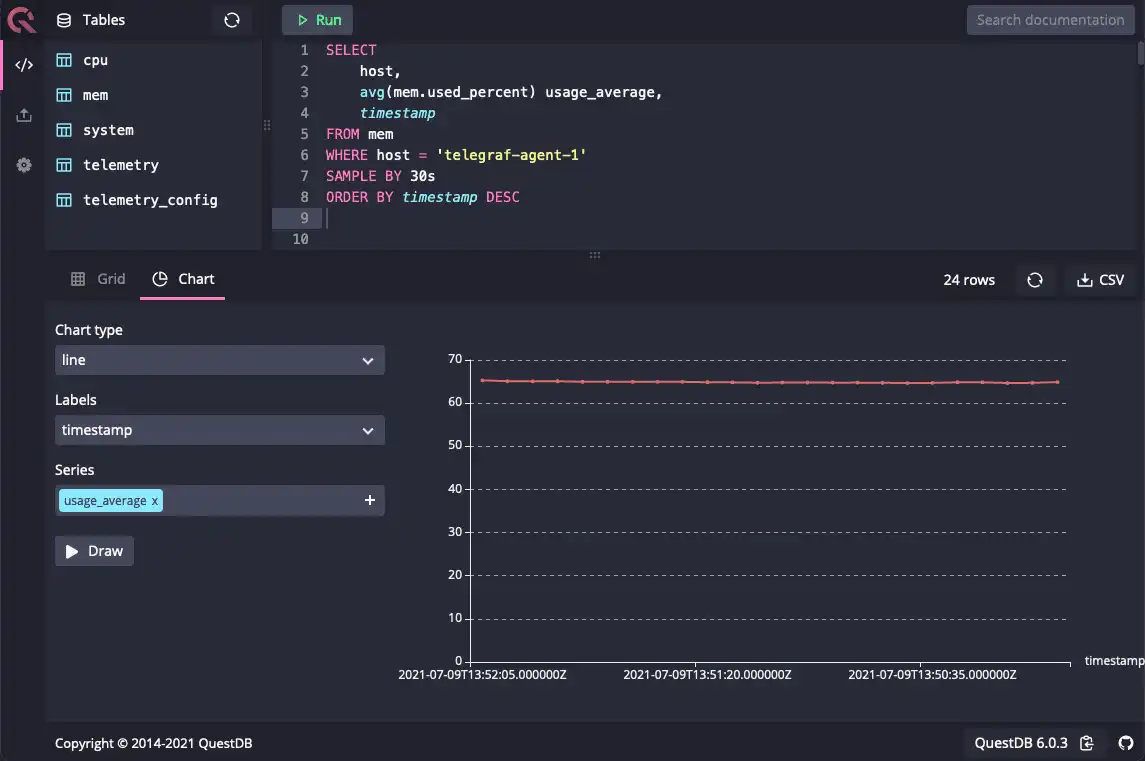
SELECThost,avg(mem.used_percent) usage_average,timestampFROM memWHERE host = 'telegraf-agent-1'SAMPLE BY 30sORDER BY timestamp DESC
The basic in-built charting functionality that QuestDB has can be used like so:
- Click the Chart tab
- Set Chart type to
line - Set Labels to
timestamp - Plot
usage_averageas a Series and click Draw
Summary
We've installed QuestDB on DigitalOcean using the new Marketplace offering for QuestDB, set up multiple Droplets to report actual metrics to QuestDB via Telegraf, and visualized these metrics on the interactive console. This tutorial shows how easy it is to send real system metrics as time series data to a database like QuestDB for reports and visualization.
For next steps, we can experiment with some of the additional integrations that Telegraf supports to grab insights from other applications and use the Grafana integration that QuestDB offers to set up more detailed dashboards for visualization or even alerting and notifications.
If you like this content, we'd love to know your thoughts! Feel free to share your feedback or come and say hello in the community forums.