Coinbase is a leading cryptocurrency exchange platform founded in 2012. It has become a key player in the digital currency space, in large part due to its adherence to regulatory structures and its ease of use. But have you ever wondered how an exchange like Coinbase makes money? We know they collect fees, but how does that actually shake out?
In our 7.3.7 release,
we rolled out new sum() & over() window functions. These functions make it
possible to calculate cumulative sums over an interval of time. We can use such
functions to derive all kinds of useful information, and to answer our central
question.
In this post, we'll estimate crypto exchange revenue based on publicly available trading flows. You don't need to be a technical or financial expert.
How does an exchange make money?
A crypto exchange typically makes money by taking a percentage on every trade. A simplistic example is, consider that they charge 0.10% (10 basis points) on the notional value of each trade. For a trade worth 20`. The amount is multiplied by two because the transaction involves two parties, and each party pays the fee.
In practice there are other important considerations and the fees can vary greatly. The two main variables are:
-
Whether the exchange has a varying fee structure or a tiered fee structure or discounts for, say, holding a certain quantity of the exchange token
-
Whether the exchange charges differently - or even pays for - Maker trades as opposed to Taker trades
Let's dig into both.
About tiered fee structures
Crypto exchanges do not typically charge the same level of fees to all traders. Instead, they implement a tiered fee system whereby traders who bring more volume to the exchange are compensated with lower fees.
This provides an incentive. More active traders are encouraged to send all their orders to a particular exchange instead of, say, slicing orders across exchanges.
We can look at Coinbase Exchange Fees, as an example.
A reminder for those not fluent in financial jargon that bps represents basis
points, and 10bps is equivalent to .10%:
| Tier | Taker Fee | Maker Fee |
|---|---|---|
| 10K | 60bps | 40bps |
| 50K | 40bps | 25bps |
| 100K | 25bps | 15bps |
| 1M | 20bps | 10bps |
| 15M | 18bps | 8bps |
| 75M | 16bps | 6bps |
| 250M | 12bps | 3bps |
| 400M | 8bps | 0bps |
| $400M+ | 5bps | 0bps |
If someone were new to Coinbase and placed a market order for 30) of fees to the exchange. A user who has already traded 9). At scale, these are significant "savings" for the high volume trader.
Maker trades vs Taker trades
Before we layout Maker trades and Taker trades, let's cover liquid orderbooks.
If an exchange has a liquid orderbook, one can buy or sell large amounts of assets without causing much change in the underlying prices. As a result, there is often a small difference between the buying and selling prices and lots of buy and sell orders occur at different price levels.
Exchanges with liquid orderbooks are more attractive than exchanges with thin liquidity in their orderbooks.
To help increase an orderbook's liquidity, exchanges encourage users to place passive limit orders instead of standard market (aka Taker) orders that lead to immediate trades.
For this reason, many exchanges choose to apply lower fees to passive orders so that their users then also add liquidity.
For example, we'll consider Alice & Bob:
- Alice has never traded on Coinbase. She wants to buy $5,000 worth of crypto, but there is no urgency to do so. She places a limit order. The order gets added to the orderbook and this results in increased liquidity.
- Bob traded 5,000 worth of crypto. He wants to trade immediately. He places a market order which instantly gets executed against Alice's order.
- Alice is a 'Maker', she pays the 10K fee tier which is
40bps:.20 * $5000 + $20 - Bob is a 'Taker', he will pay the 75M fee tier which is 16bps:
.16 * $5000 = $8 - The exchange made
$28on the trade
Liquidity is so crucial that some exchanges go even further to encourage the posting of orders. They sometimes apply negative Maker fees. With negative Maker fees, the Maker is paid for trading.
An example of this is the Bitmex exchange. They apply
negative Maker fees on some
tiers. In this case, assuming the Taker fee for a particular trade is 2.4bps
and the Maker fee is -0.3bps, then:
- The Taker pays
2.4bps - The Maker receives
0.3bps - The exchange makes the difference,
2.1bps
Calculating exchange revenues
OK! Revenues. How much is an exchange making? How much are they making today?
We can estimate a range of revenue made by the exchange today based on their reported trades. This requires us to take the following steps:
-
Calculate a cumulative sum of trades over a period
-
"Guesstimate" the 'average' fee paid by the exchange users or at least determine a rational fee range
But first, a Quest(DB)
If you want to follow along, then you'll need a couple things.
First, download QuestDB or visit the demo instance.
Then download Grafana.
Finally, to connect Grafana to QuestDB, follow the Grafana docs.
The demo instance has appropriate (historical) data that mirrors our
investigation. The queries below will work, however they are designed to be
placed within Grafana vs. the QuestDB Web Console so they will require editing.
Still, the trades table in the demo instance can be queried for BTC-USD &
ETH-USD.
This data in particular was pulled using the cryptofeed library. See this tutorial to set it up quickly and start ingesting real trades from the largest crypto exchanges directly into QuestDB.
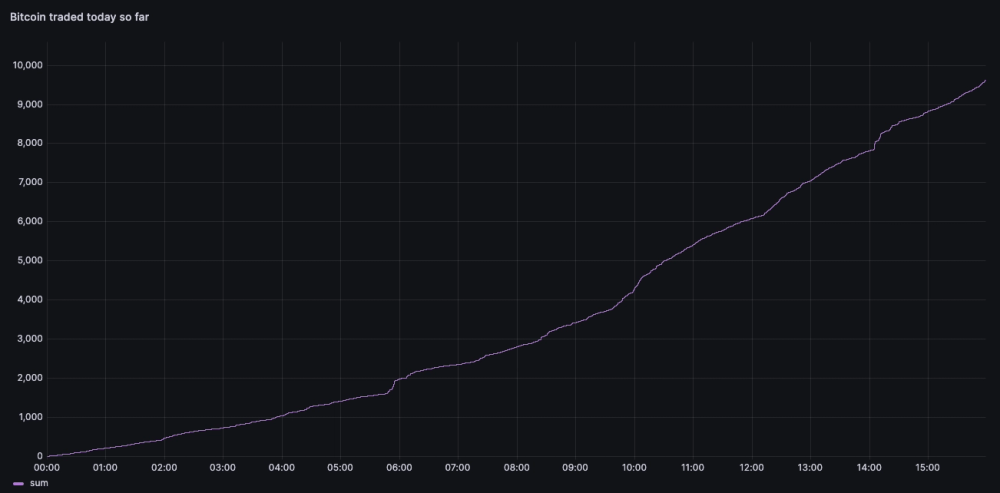
Applying cumulative sum
The cumulative sum function allows us to calculate a sum of all trade volume in a given interval.
In the context of a Grafana dashboard, we can use the following query to calculate the quantity of BTC traded against USD today:
SELECT
  timestamp,
  sum(amount)
    OVER (
      ROWS BETWEEN UNBOUNDED PRECEDING AND CURRENT ROW
    ) AS bitcoin_traded
FROM
  trades
WHERE
  symbol = 'BTC-USD'
AND
  $__timeFilter(timestamp);
Deriving Coinbase's revenue
To understand the total value of the trades, we can multiply the amount traded by its price. This calculation gives us the notional value, or the total money value of the trades.
Additionally, we can modify our calculations to factor in the average fees for
buyers and sellers. For this purpose, we can use two variables in Grafana, named
takerFeeBps and makerFeeBps, to include these fees in our analysis:
SELECT
  timestamp,
  sum(amount*price*($makerFeeBps+$takerFeeBps)/10000)
    OVER (ROWS BETWEEN UNBOUNDED PRECEDING AND CURRENT ROW) bitcoin_traded,
FROM trades
WHERE symbol = 'BTC-USD'
AND $__timeFilter(timestamp);
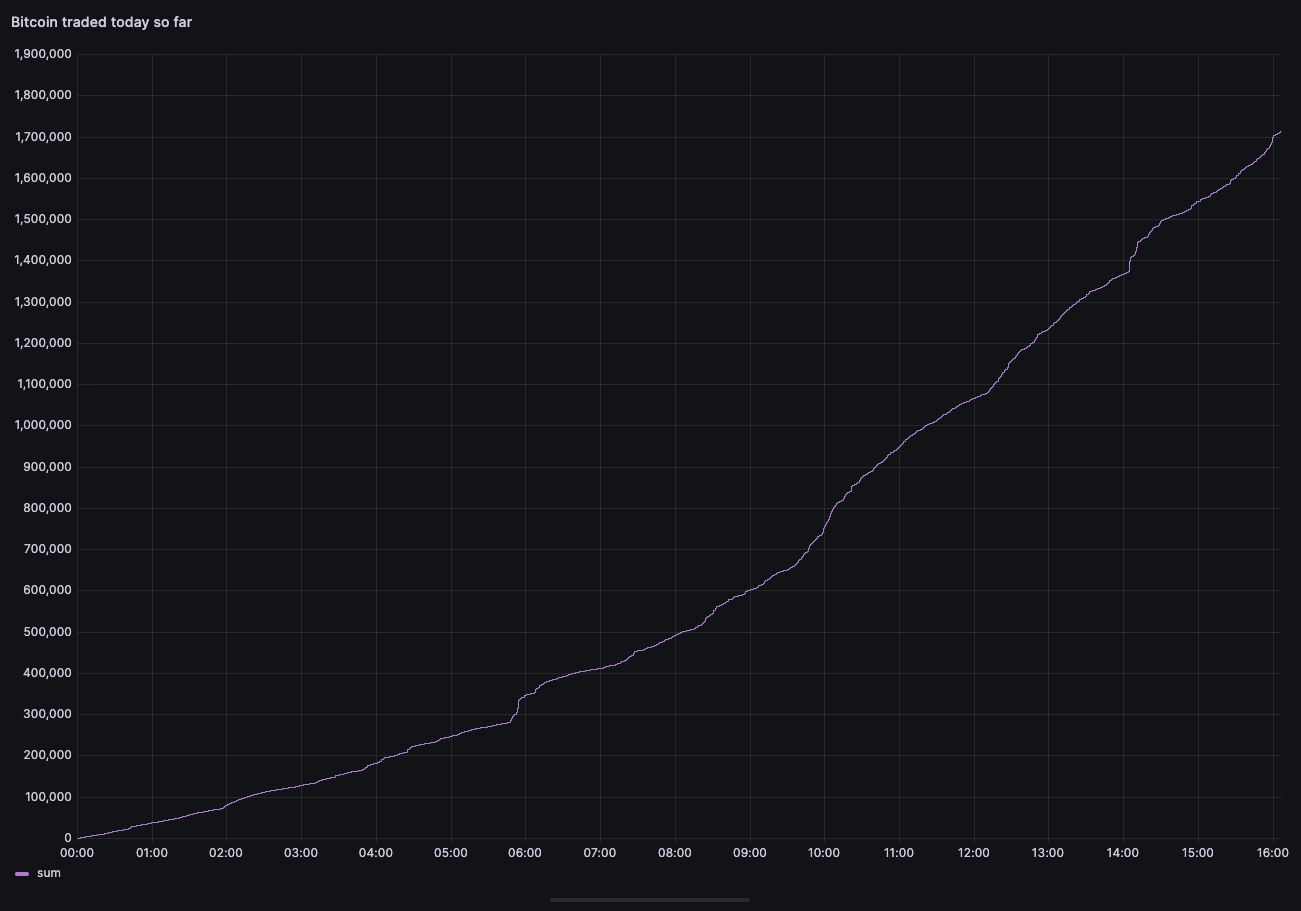
Using values of 25bps and 15bps respectively, we get the following chart. Based on our fee assumptions, the estimated revenue on BTC-USD for Coinbase so far today would be around $1.7M:
Building a range
Since we're not sure of the exact fees paid on average, we can get creative. We'll add a series to cover other fee assumptions. From the series, we can derive a range. Let's compute the same query but with one series for each tier:
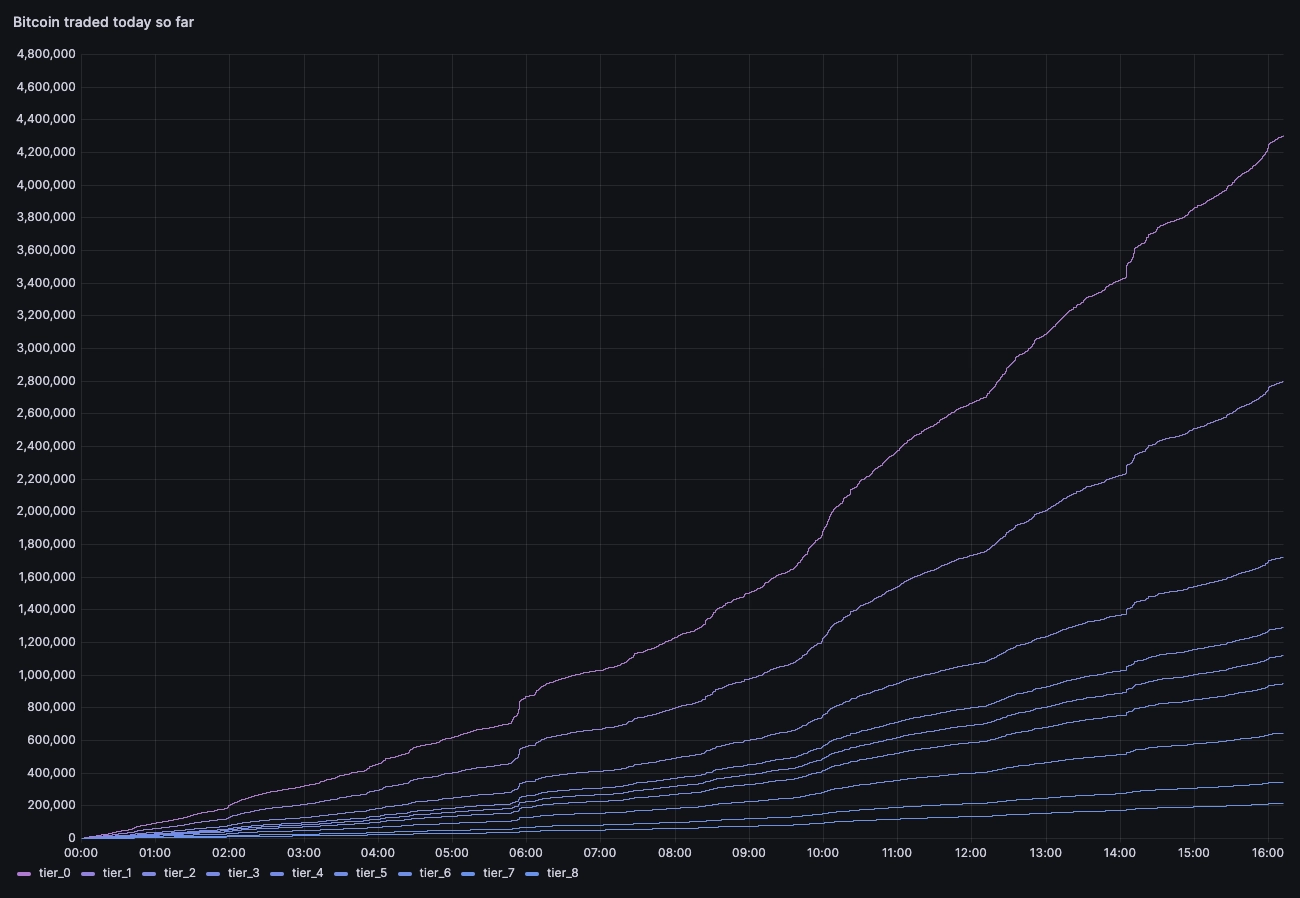
The resulting range is very wide!
Looking at the top end and bottom end is interesting:
- If all participants were in the cheapest tier, then the Coinbase revenue on BTC-USD trading would be $215K so far today
- If all participants were in the most expensive tier, then that revenue would be 20x larger at nearly $4.4M
Comparing to other pairs
Our analysis so far has included only BTC-USD. Together, BTC + USD create a trading pair. Bitcoin is exchanged for US Dollars. But on a busy exchange there are many pairs, representing exchanges in the forms of cryptocurrency-to-cryptocurrency or cryptocurrency-to-dollar. Knowing all revenue is only possible by observing each pair and every pair.
We demonstrated above that the range of revenues without knowing fee structures is significant. And again, that was only for one pair. To assess revenues across all pairs, we'll want to normalizing towards a single fee structure for all trades. To do so, we'll determine a base Taker & Maker basis point fee.
Let's use 25bps Taker and 15bps Maker to compare relative revenue with other pairs against the USD:
SELECT timestamp, symbol,
  sum(amount*price*(25+15)/10000)
  OVER(PARTITION BY symbol ROWS BETWEEN UNBOUNDED PRECEDING AND CURRENT ROW) revenue
FROM trades
WHERE
  $__timeFilter(timestamp)
  AND symbol LIKE '%-USD'
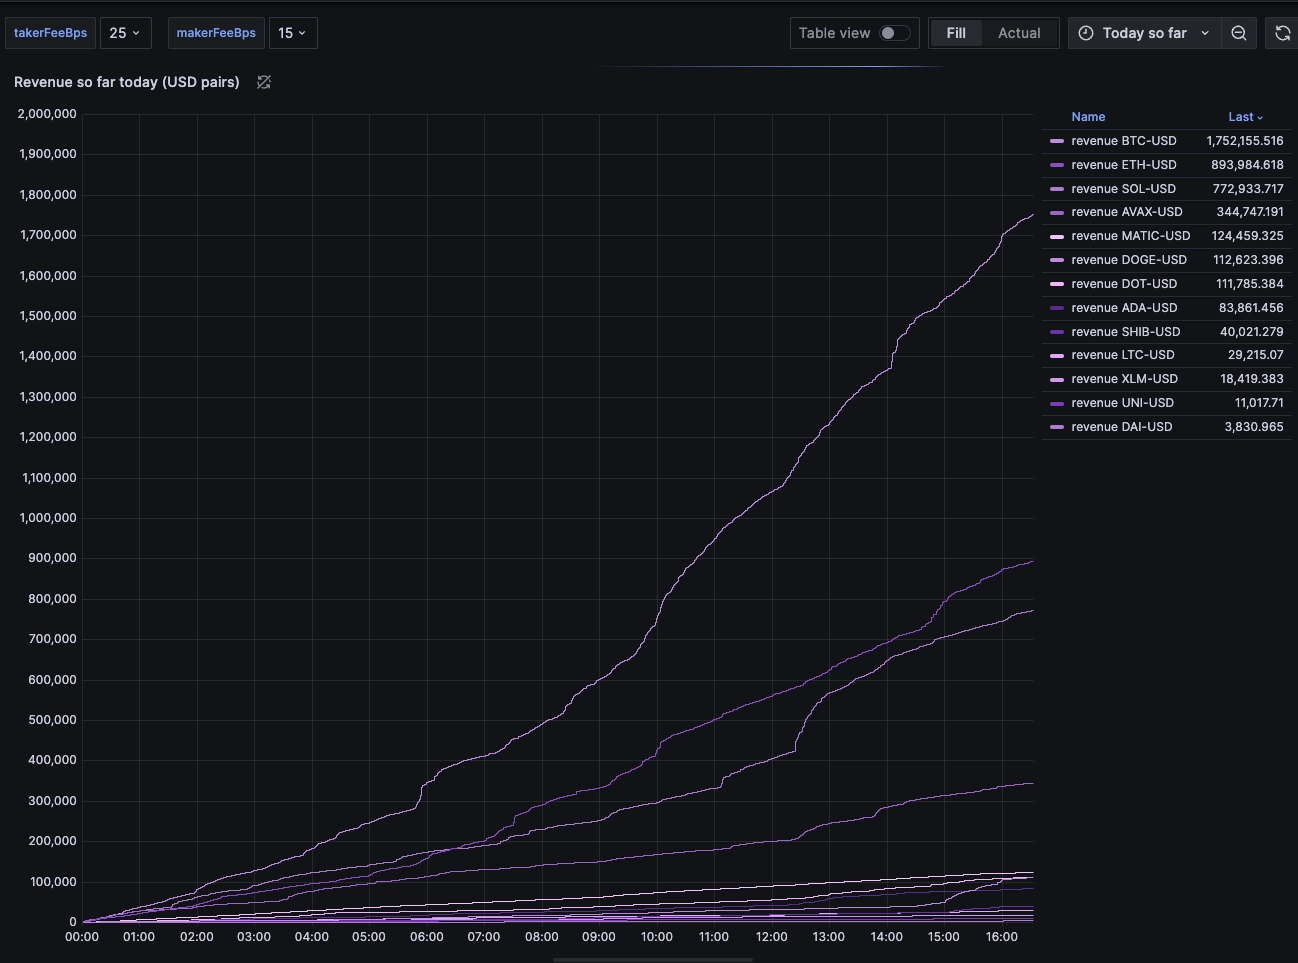
We can see the revenue split as follows:
- BTC-USD is the main money maker
- ETH-USD is second, and generates half as much as BTC-USD
- SOL-USD is in third place with similar revenue as ETH-USD
Another chart type may help visualize this data.
How about a pie chart?
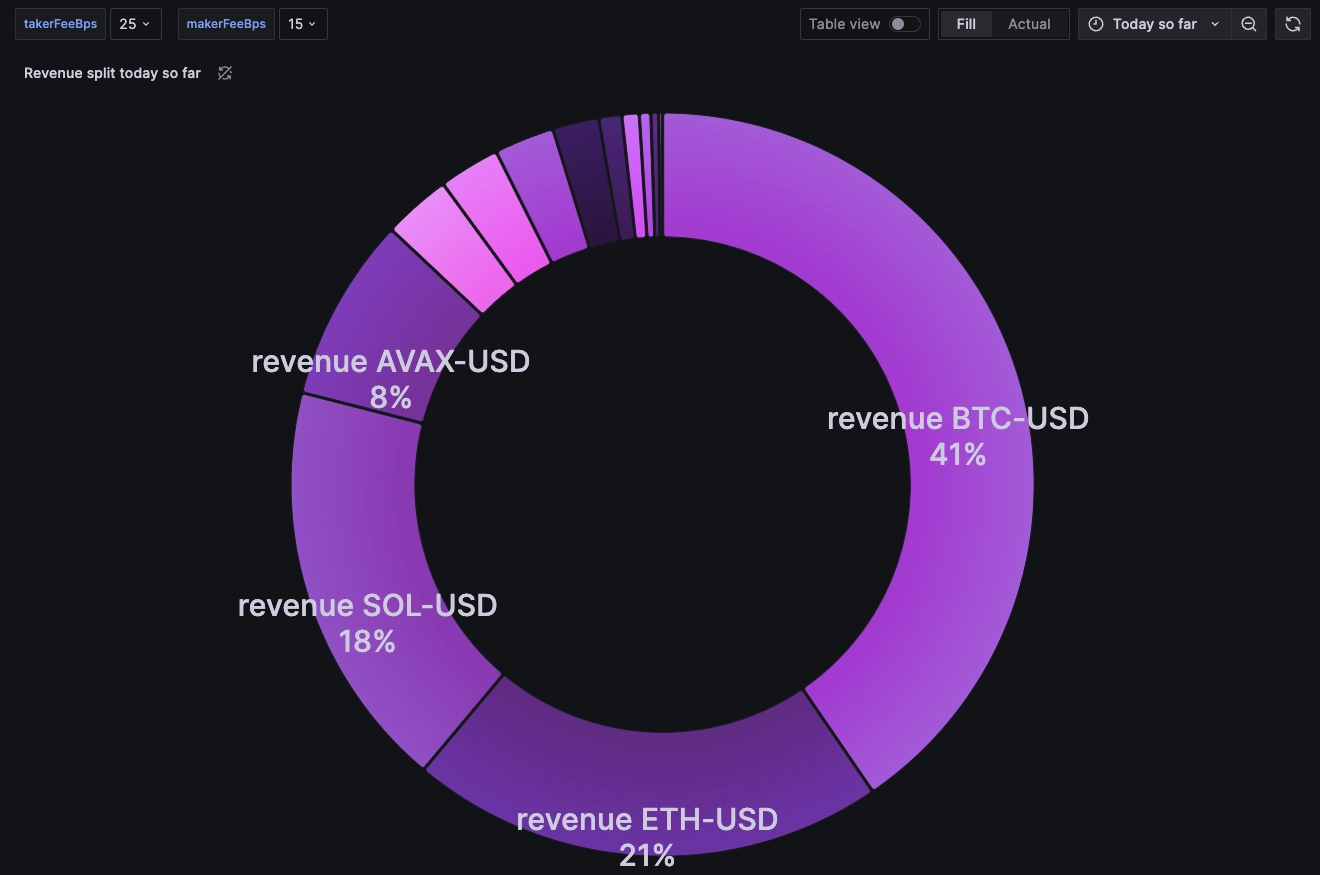
Based on the trades observed so far today, and regardless of the fee structure assumption, the chart shows that the top 3 pairs account for 80% of the trading revenue. Although, do note that this is only for pairs against the US Dollar.
So, is Coinbase having a good day?
It's fascinating to analyze these transactions - especially in realtime.
We can change the query to adjust for the dates and use dateadd to then force
the timestamps to be within the current Grafana window for comparison.
For example:
WITH x AS
 (
  SELECT
    dateadd('d',7,timestamp) timestamp,
    sum(amount*price*(25+15)/10000)
    OVER(ROWS BETWEEN UNBOUNDED PRECEDING AND CURRENT ROW) revenue
  FROM trades
  WHERE
    timestamp BETWEEN
      date_trunc('day', dateadd('d',-7,systimestamp()))
      AND date_trunc('day', dateadd('d',-6,systimestamp()))
    AND symbol LIKE '%-USD'
  )

SELECT
  timestamp,
  last(revenue) revenue_last_week
FROM x timestamp(timestamp)
SAMPLE BY 1m
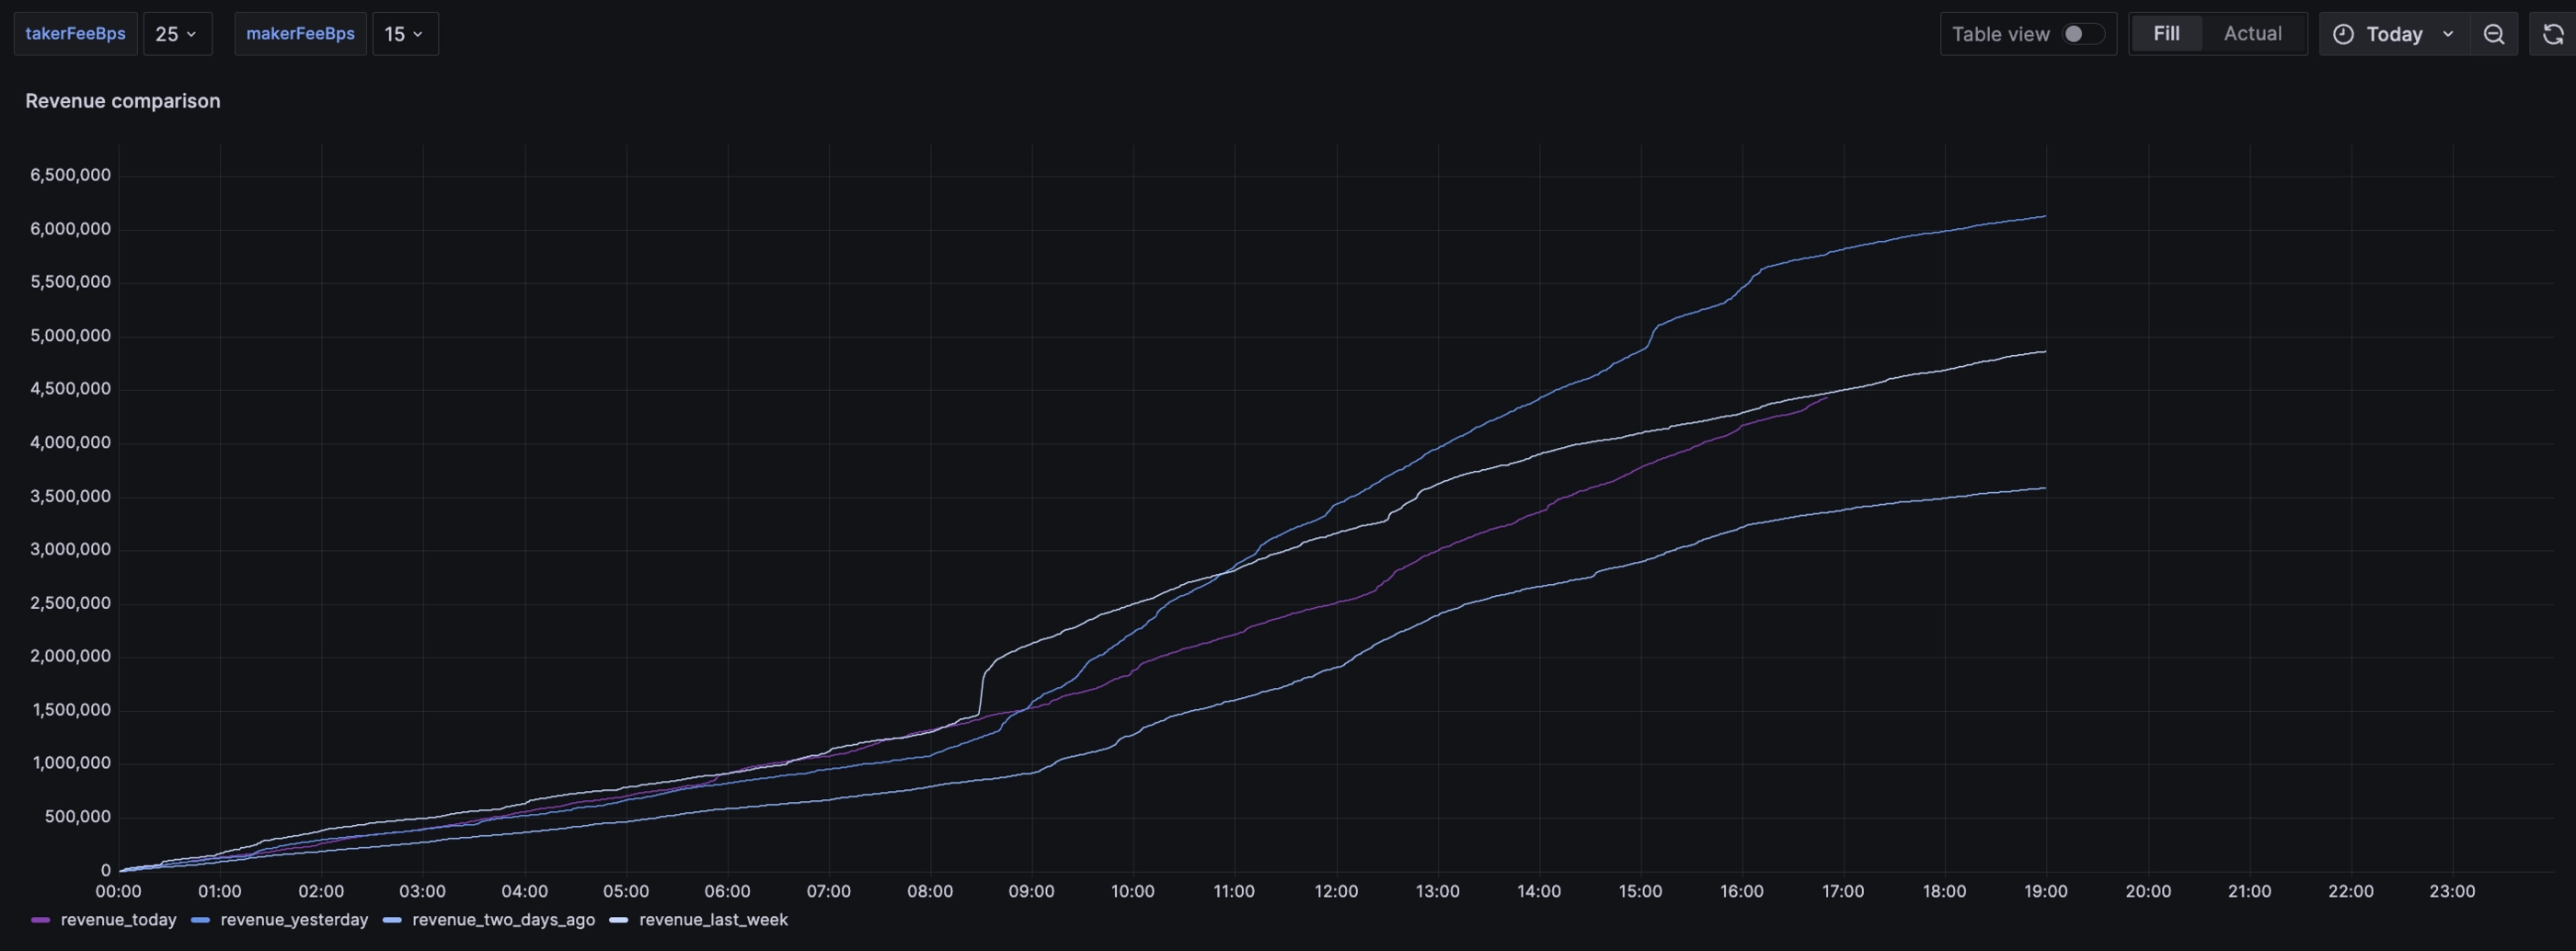
Armed with all this, we should be able to tell if Coinbase is having a good day… in realtime! Today looks pretty, pretty good.
Summary
We dove into window functions and how they can be used to determine revenues for massive exchanges like Coinbase in realtime. There is enough of a start that with a few more robust queries, you can analyze currency pairs beyond USD, and work towards more precision in your estimation.