Combine Java and Rust Code Coverage in a Polyglot Project
Our QuestDB codebase has been gaining a significant amount of Rust code lately. While we're a Java-first project, our idiosyncratic take on it – zero garbage, most data accessed through mmapped files and native heap allocation – means that we mesh naturally well with a systems programming language like Rust. Check out our recent blog post for more insight.
One of the trickier aspects of allowing a new language into your codebase is testing. Java is really great here. Apart from a very mature and capable testing and continuous integration (CI) framework, it's also quite easy and convenient to generate a test coverage report, which answers the question: "Which lines of code are exercised by the tests?"
But, what happens when a significant part of your code is Rust behind JNI? In this post I'll take you through the steps that achieve the following setup for your CI builds:
- Run native Rust tests, recording their code coverage
- Run Java tests, recording the coverage of both Java and Rust code
- Merge everything into a unified report and attach it to an open PR, focused on just the diff of that PR
The end result is that a comment like this appears on your PR:
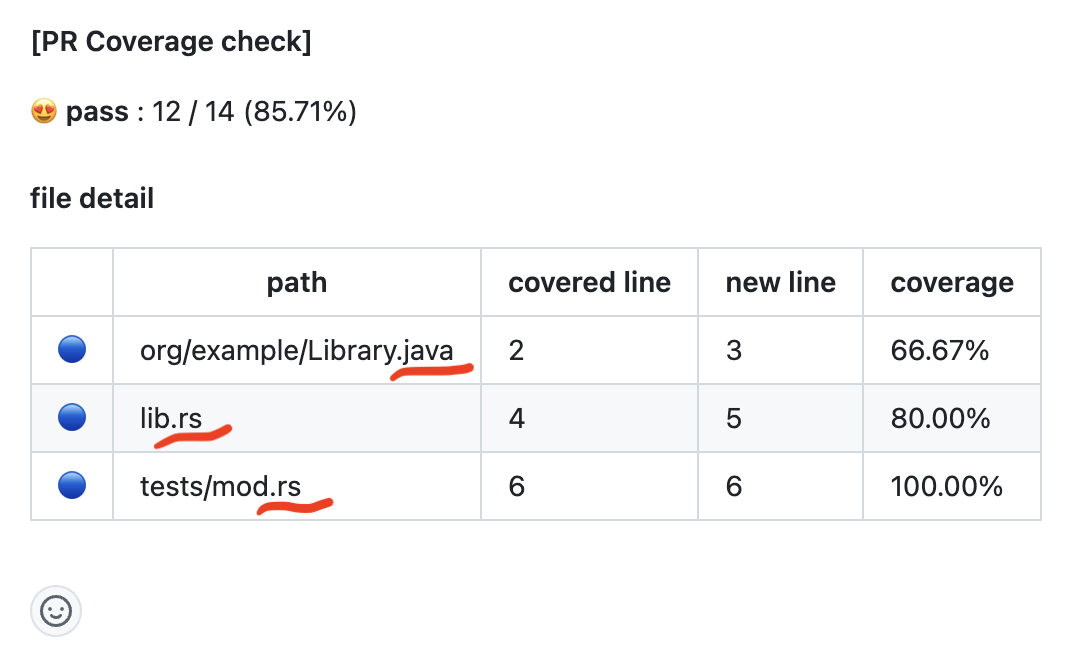
You can see the above comment in an example pull request on the demo project accompanying this post. It includes some Java code and a native library built in Rust that gets called through JNI. It also includes a complete GitHub workflow file that performs the steps needed to create the comment.
Why Rust is a great choice for us
According to the latest StackOverflow developer survey, Rust has entered the mainstream, being as popular as Go, and significantly more popular than Kotlin. Many projects that were originally started in a more established language like Java are opening up to the opportunity to add Rust code into their mix. It has a great, modern toolchain and is generally a pleasure to work with.
The architecture of Java, with its bytecode and the JVM, makes code instrumentation an obvious feature to support – and indeed, there's a standard way to do it. This is the essential foundation that allows a 3rd-party tool to implement code coverage reporting, the favorite one being JaCoCo. The Maven JaCoCo plugin makes integrating it into your CI workflow a breeze.
It is a bit less known that, since Rust is built upon the great foundation of
the LLVM, it too gets almost the same level of convenience! Even though the
integration between Rust's cargo and LLVM tooling for mixed-language projects
is still a bit rough, it's pretty easy to use it after dealing with a few
initial frustrations. LLVM has ready-made tooling that will provide you with a
coverage report, including a nice HTML visualization.
Use JUnit to test Rust code behind JNI?
So far so good, but the way we use Rust is by allocating native-memory data structures in Java, and then passing naked pointers to it to Rust. Testing such code with a Rust test is not only cumbersome, but involves quite complex code to replicate the same data structures. Having complex, buggy test fixtures is a great way to ruin your day.
The ideal answer is we set things up so that we can run a JUnit test that calls into the dynamic library built in Rust, and somehow that library should on its own create a file with the data on lines of code that were accessed. And… that's exactly what it will do, with surprisingly little work! Read on to learn the details.
Set up Java code coverage
This is the standard Maven boilerplate that installs a JaCoCo agent into the JVM running the tests, and outputs the code coverage report:
<build><plugins><plugin><groupId>org.jacoco</groupId><artifactId>jacoco-maven-plugin</artifactId><version>0.8.12</version><executions><execution><id>default-prepare-agent</id><goals><goal>prepare-agent</goal></goals></execution><execution><id>default-report</id><phase>test</phase><goals><goal>report</goal></goals></execution></executions></plugin></plugins></build>
Its output is in target/site/jacoco, and there's both the HTML format for
direct inspection, and the jacoco.xml file with the data you can use in
further processing steps.
Set up Rust code coverage
The most basic step to get raw coverage data from a Rust test run is just this:
RUSTFLAGS="-C instrument-coverage" cargo test
This creates two .profraw files in the project home directory, with some ugly
names. You can add another environment variable to set the desired filename:
LLVM_PROFILE_FILE=rust-coverage.profraw RUSTFLAGS="-C instrument-coverage" cargo test
This will produce a single file with all the data. The format of this file is optimized for writing to it live as the process is running. It's highly specific to the exact LLVM version used by Rust.
To export the data to a standard format, you need some LLVM tooling. First, this is how you install it:
rustup component add llvm-tools-preview
And the rough part is, this doesn't add any commands on your path, nor does it
allow you to run them using cargo run. So we'll have to work around it like
this:
LLVM_TOOLS_PATH=$(dirname $(find $HOME/.rustup -name llvm-profdata))PATH=$LLVM_TOOLS_PATH:$PATH
Now we're ready to use the first conversion step, from the raw format into the
standard LLVM .profdata format:
llvm-profdata merge -sparse -o rust-coverage.profdata rust-coverage.profraw
Next, we use llvm-cov to generate the coverage report. For that we need access
to the binary executable that runs the tests. It has a mangled filename, but we
can use find to catch it automatically:
test_bin=$(find target/debug/deps -type f -executable | grep coverage_demo-)llvm-cov show --format=html \--ignore-filename-regex='(.cargo/registry|rustc/.*\.rs)' \--instr-profile rust-coverage.profdata \--object $test_bin \--output-dir=rust-coverage
The grep coverage_demo- part assumes our crate's name is coverage-demo.
Also, the predicate -executable works for Linux; on MacOS, use -perm +111
instead.
This is it, now you can open rust-coverage/index.html in your browser and see
the coverage report!
Set up dynamic library coverage
So far, we went through the basic steps that get code coverage going for each language in isolation. Now we'll use these building blocks to get them integrated.
Our demo project contains this Java declaration:
public static native int nativeIncIfTrue(int n, boolean condition);
And its Rust implementation:
#[no_mangle]pub extern "system" fn Java_org_example_Library_nativeIncIfTrue(_env: JNIEnv,_class: JClass,n: i32,condition: bool,) -> i32 {if condition {return n + 1;} else {return n;}}
I have a JUnit test that touches this code:
@Testpublic void testNativeIncWhenTrue() {var result = Library.nativeIncIfTrue(1, true);Assert.assertEquals(2, result);}
And my goal is to have the execution of this test acknowledged for covering the Rust code.
The first step is building the library. It's easy enough to build it with
cargo build, but I want the result placed where JNI looks for it, which is
deep inside Maven's target/classes directory structure. I also want it to work
smoothly with mvn clean test – this is especially challenging because clean
deletes the target directory, limiting our options.
My QuestDB colleague Adam Cimarosti built a very useful Maven plugin for Rust:
org.questdb:rust-maven-plugin,
so I'm using it in this project.
<build><plugins><plugin><groupId>org.questdb</groupId><artifactId>rust-maven-plugin</artifactId><version>1.2.0</version><executions><execution><id>demo-build</id><goals><goal>build</goal></goals><configuration><path>rust/coverage-demo</path><release>false</release><copyTo>${project.build.directory}/classes/org/example</copyTo><environmentVariables><RUSTFLAGS>-C instrument-coverage</RUSTFLAGS></environmentVariables></configuration></execution></executions></plugin></plugins></build>
This builds the library and places it where it needs to be. Let's also add the
LLVM_PROFILE_FILE environment variable to JUnit test execution:
<plugin><groupId>org.apache.maven.plugins</groupId><artifactId>maven-surefire-plugin</artifactId><configuration><environmentVariables><LLVM_PROFILE_FILE>maven-test.profraw</LLVM_PROFILE_FILE></environmentVariables></configuration></plugin>
With this in place, a regular mvn clean test will run against the instrumented
dynamic library. You can now take maven-test.profraw through the steps we
described above and get the test coverage of the Rust source code, except this
time the file to supply with --object is the dynamic library:
target/classes/org/example/libcoverage_demo.so (MacOS uses the .dylib
extension instead).
Put it all together
So far we saw what it takes to get code coverage from three different places:
- Java code via JUnit tests
- Rust code via
cargo test - Rust code via JUnit and JNI
The minor remaining thing is getting cargo test integrated with mvn test,
which will mean a single test run provides us with the complete picture of code
coverage in our mixed project.
This is a simple addition. It's just another execution of rust-maven-plugin in
the test phase:
<execution><id>demo-test</id><goals><goal>test</goal></goals><phase>test</phase><configuration><path>rust/coverage-demo</path><release>false</release><environmentVariables><RUSTFLAGS>-C instrument-coverage</RUSTFLAGS><LLVM_PROFILE_FILE>cargo-test.profraw</LLVM_PROFILE_FILE></environmentVariables></configuration></execution>
This will result in two .profraw files: one from JUnit tests, one from cargo
tests. llvm-profdata makes it very easy to merge both of them into a
.profdata file:
llvm-profdata merge -sparse -o rust-coverage.profdata \maven-test.profraw \rust/coverage-demo/cargo-test.profraw
Send a report to your PR
The HTML coverage reports we have at this point are pretty useful already. You can study them and see where the gaps in your tests are. On a larger project, however, studying the whole report is overwhelming. There are hundreds of files, and tens of thousands of lines of code.
One useful thing to do for each pull request is to focus only on the lines of code that it adds or changes. You can then implement a policy that says, for example, that at least 75% of all the changed lines must be covered by tests. The percentage is a bit arbitrary, and takes experience to set at the right level. For us at QuestDB, this kind of policy has worked pretty well and thanks to it, test coverage isn't a separate concern, but one integral to every PR.
There's a piece of software that does all of the above automatically:
cover-checker. You provide it with
the test coverage files, your repo URL and the ID of a PR on it, and it posts a
comment on the PR with a coverage report focused just on the lines of code the
PR touches. When used in CI as a mandatory PR check, it will make the PR checks
fail when the covered percentage is below the set threshold.
NOTE: We built the
cover-checkerJAR ourselves from the project's main branch because the version 1.5.0 was not released as of this writing.
Here's an example invocation:
java -jar lib/cover-checker-1.5.0-all.jar \-type jacoco --cover target/site/jacoco/jacoco.xml \-type cobertura --cover rust-coverage.xml \--repo mtopolnik/coverage-demo --pr 1 --github-token ghp_48ywzbddfh5dh3 \--threshold 75
To use it with Rust coverage reports, there's one last missing piece. We have
the data in LLVM's LCOV format, but cover-checker only supports JaCoCo and
Cobertura formats. Luckily, there's a tool for that conversion out there as
well, a
Python script.
This code will do:
[ ! -f lcov_cobertura.py ] && wget \https://raw.githubusercontent.com/eriwen/lcov-to-cobertura-xml/master/lcov_cobertura/lcov_cobertura.pypython3 lcov_cobertura.py rust-coverage.lcov \--base-dir rust/coverage-demo/src \--output rust-coverage.xml
Once you've run cover-checker, go to your PR and check out the comment that
just appeared on it!
Advanced scenario: multiple test runs
In a realistic larger project, we may want to parallelize our test runs to improve the time taken by the PR checks. This means we'll end up with multiple coverage reports, and we'll need to merge them.
We already saw that llvm-profdata supports this out of the box. You just name
as many .profraw files as you need. JaCoCo supports this as well, with its
merge Maven goal. Here's the code we use in QuestDB, in a
separate POM file:
<plugin><groupId>org.jacoco</groupId><artifactId>jacoco-maven-plugin</artifactId><version>0.8.8</version><executions><execution><id>merge-results</id><phase>verify</phase><goals><goal>merge</goal></goals><configuration><fileSets><fileSet><directory>${includeRoot}</directory><includes><include>**/*.exec</include></includes></fileSet></fileSets><destFile>${mergedReport}</destFile></configuration></execution><execution><id>post-merge-report</id><phase>verify</phase><goals><goal>report</goal></goals><configuration><dataFile>${project.build.directory}/coverage-reports/aggregate.exec</dataFile><outputDirectory>${outputDirectory}</outputDirectory></configuration></execution></executions></plugin>
Conclusion
As someone who truly enjoys programming in Rust, I'm excited to see developers around the world joining in and building up its ecosystem. The fact that you can not just write Rust alongside Java, but integrate it so well into your CI pipeline, is a great sign that it has risen to the level of a mainstream language.
For reference, let me repeat here a link to the demo GitHub project. There's also a demo PR where you can see the attached report.
Interested in Rust? Have something to share? Let us know on social media or in our lively Slack community!