Time-Series Data Visualization with Apache Superset and QuestDB
One of the most common uses of a time-series database is visualizing data on a dashboard to inform business decisions. This tutorial will show you how to connect QuestDB and Apache Superset. QuestDB is an open-source time-series database and Apache Superset is an open-source data exploration and visualization platform. By combining these, you can create a dashboard displaying data from multiple tables.
Installing and starting QuestDB
If you are not yet using QuestDB, or if you are using a version lower than 7.1.2, please refer to our documentation. In my case, I start a QuestDB instance (with ephemeral storage) using Docker:
docker run \-p 9000:9000 -p 9009:9009 -p 8812:8812 -p 9003:9003 \questdb/questdb:7.1.2
The datasets
We will be working with two datasets that we need to download and import into QuestDB. The first one represents taxi rides in the city of New York. The original dataset is very large. Therefore, we are going to work with a subset that represents a few minutes of taxi rides on January 1st, 2018. You can download and import the dataset from the command line using curl:
curl https://raw.githubusercontent.com/javier/questdb-quickstart/main/trips.csv > trips_2018.csvcurl -F data=@trips_2018.csv 'http://localhost:9000/imp?overwrite=false&name=trips_2018×tamp=pickup_datetime&partitionBy=DAY'
The second dataset represents energy consumption and next-day forecast at 15-minute intervals for a few European countries. We have curated a subset of the original dataset containing data for 2018. Download the data and import it to QuestDB with:
curl https://raw.githubusercontent.com/javier/questdb-quickstart/main/energy_2018.csv > energy_2018.csvcurl -F schema='[{"name":"timestamp", "type": "TIMESTAMP", "pattern": "yyyy-MM-dd HH:mm:ss"}]' -F data=@energy_2018.csv 'http://localhost:9000/imp?overwrite=false&name=energy_2018×tamp=timestamp&partitionBy=MONTH'
If you visit your QuestDB web interface at
http://localhost:9000, you should see the two new
tables. You should have 999 rows in the trips_2018 table and 205189 rows in
the energy_2018 table.
SELECT COUNT() FROM trips_2018;SELECT COUNT() FROM energy_2018;
Installing and starting Apache Superset
You will also need a working installation of Apache Superset with the QuestDB-Connect module installed. See Superset integration for more details. I choose Docker to run Superset, and these are the steps to install it:
git clone https://github.com/apache/superset.gitcd supersettouch ./docker/requirements-local.txtecho "questdb-connect==0.0.54" >> ./docker/requirements-local.txtdocker-compose build --force-rmdocker-compose -f docker-compose-non-dev.yml pulldocker-compose -f docker-compose-non-dev.yml up
By default, your Apache Superset runs at http://localhost:8088 and login credentials are admin/admin.
Apache Superset must be initialized when started for the first time. This includes setting up default databases and sample datasets. This process may take some time before it is fully functional.
Connecting QuestDB and Superset
In Superset you create charts that you add to dashboards. Charts get their data from different databases, so the first step is to configure the database connections you will use. In our case, we need to configure a single connection to QuestDB.
Superset supports a wide range of databases by default. QuestDB is not one of them, but since we installed the questdb-connect module, we can add the connection by following these steps:
- From the Superset web interface at
http://localhost:8088, select
Settings>Database Connections - Select
+ DATABASEto add the following parameters:
SUPPORTED DATABASES: Other / DISPLAY NAME: QuestDB
SQLALCHEMY URI: questdb://admin:quest@host.docker.internal:8812/qdb
Note that I use host.docker.internal instead of localhost because I started
Superset from Docker. If you are running Superset outside of Docker, you would
need to use localhost instead.
Creating a dataset
Before you create a chart, Superset requires you to create a dataset. In its simplest form, a dataset represents a table in your database. Still, you can also add calculated columns, or create a dataset from a complex SQL statement that references one or more tables.
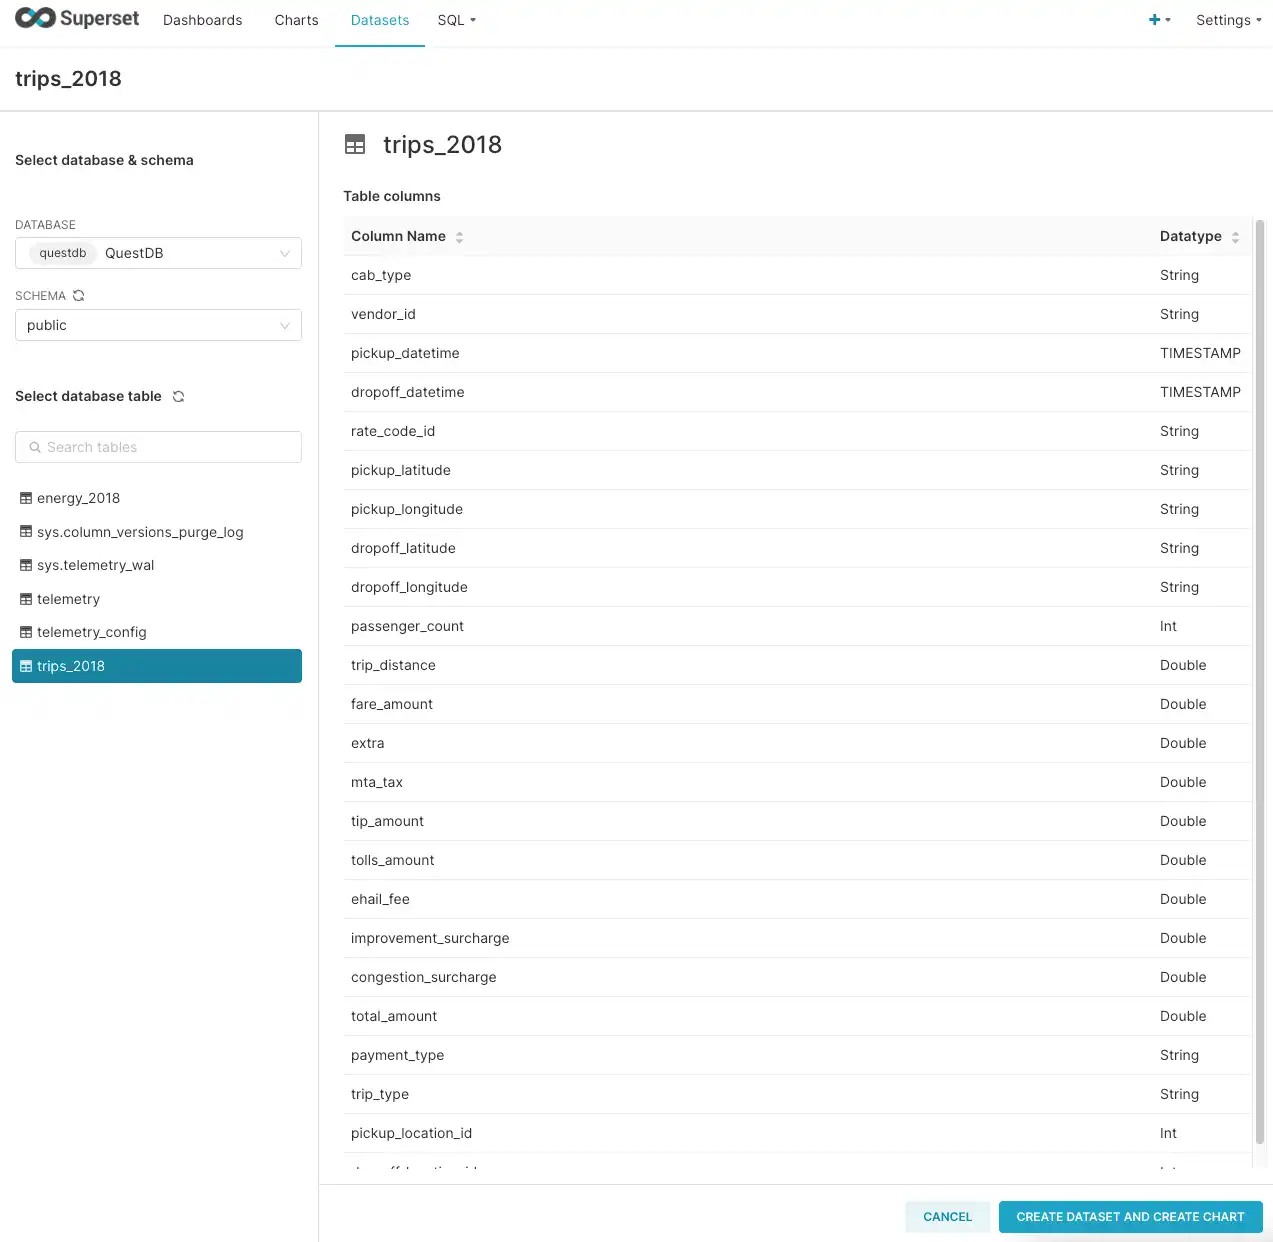
For the first dataset, let's use the trips_2018 table we created earlier.
- From the Superset web interface at
http://localhost:8088, select
Datasets>+ DATASET - Select QuestDB as the
DATABASEandtrips_2018as the table. A list of columns is displayed. - Click
CREATE DATASET AND CREATE CHART
There is also the optional step to edit the dataset by selecting Datasets. You
can remove columns and add calculated columns or metadata.
Creating your first chart
At this point, you should see a dialog to select a visualization type.
If not, select the Charts link at the top of the Superset web interface and
click the name of the dataset we created in the previous step.
We're now ready to create a chart.
Superset has many types of charts. One of the simplest charts is the Table
chart. If you cannot find the thumbnail, you can always type Table in the
search box or navigate through the different types of charts using the
categories on the left.
When you select the Table type and CREATE NEW CHART, you should see the
Chart dialog. This is virtually the same for all the charts, with different
options depending on the chart type.
At the top of this dialog, there are two tabs: one for defining the data to display, and one for customizing the chart appearance.
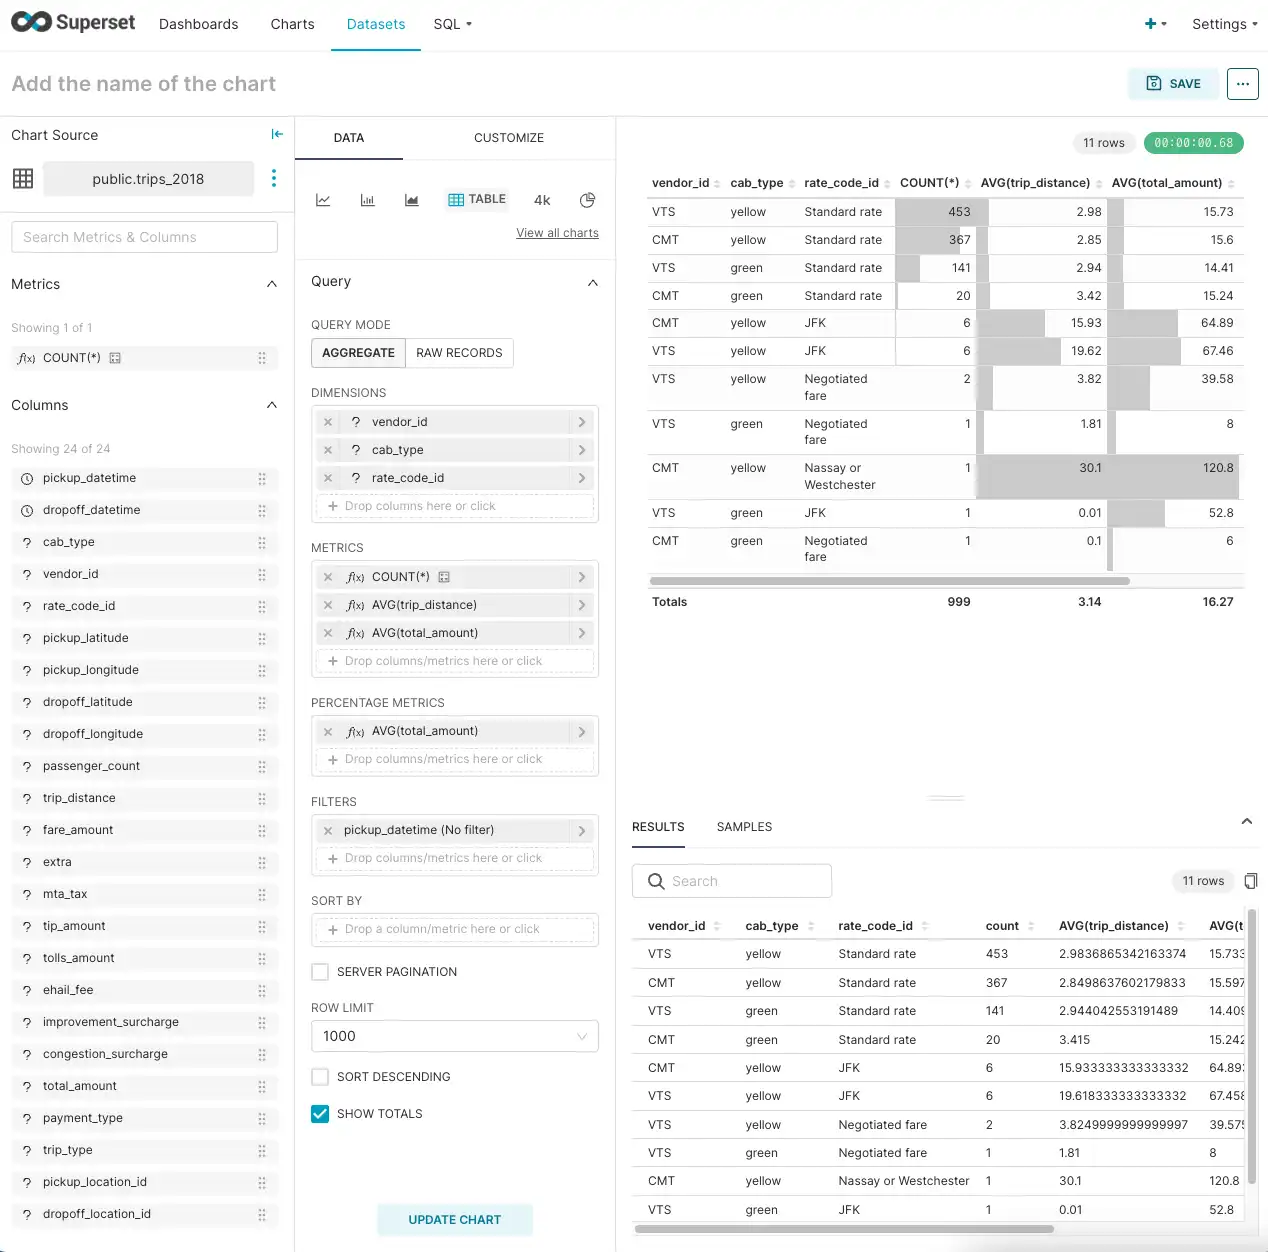
For this first chart, we want to display the total number of entries, the average trip distance, and the average total amount paid, grouped by vendor, cab type, and rate code:
- Add
vendor_id,cab_type, andrate_code_idas dimensions by dragging columns or by clicking on theDIMENSIONSbox - Add
COUNT(*),AVG(trip_distance), andAVG(total_amount)using theMETRICSbox - Add
AVG(total_amount)to thePERCENTAGE METRICSbox, so we can see how much of the total each row in the table contributes - Uncheck the
SORT DESCENDINGoption - Click
UPDATE CHART
Your screen should look very similar to the screenshot below:
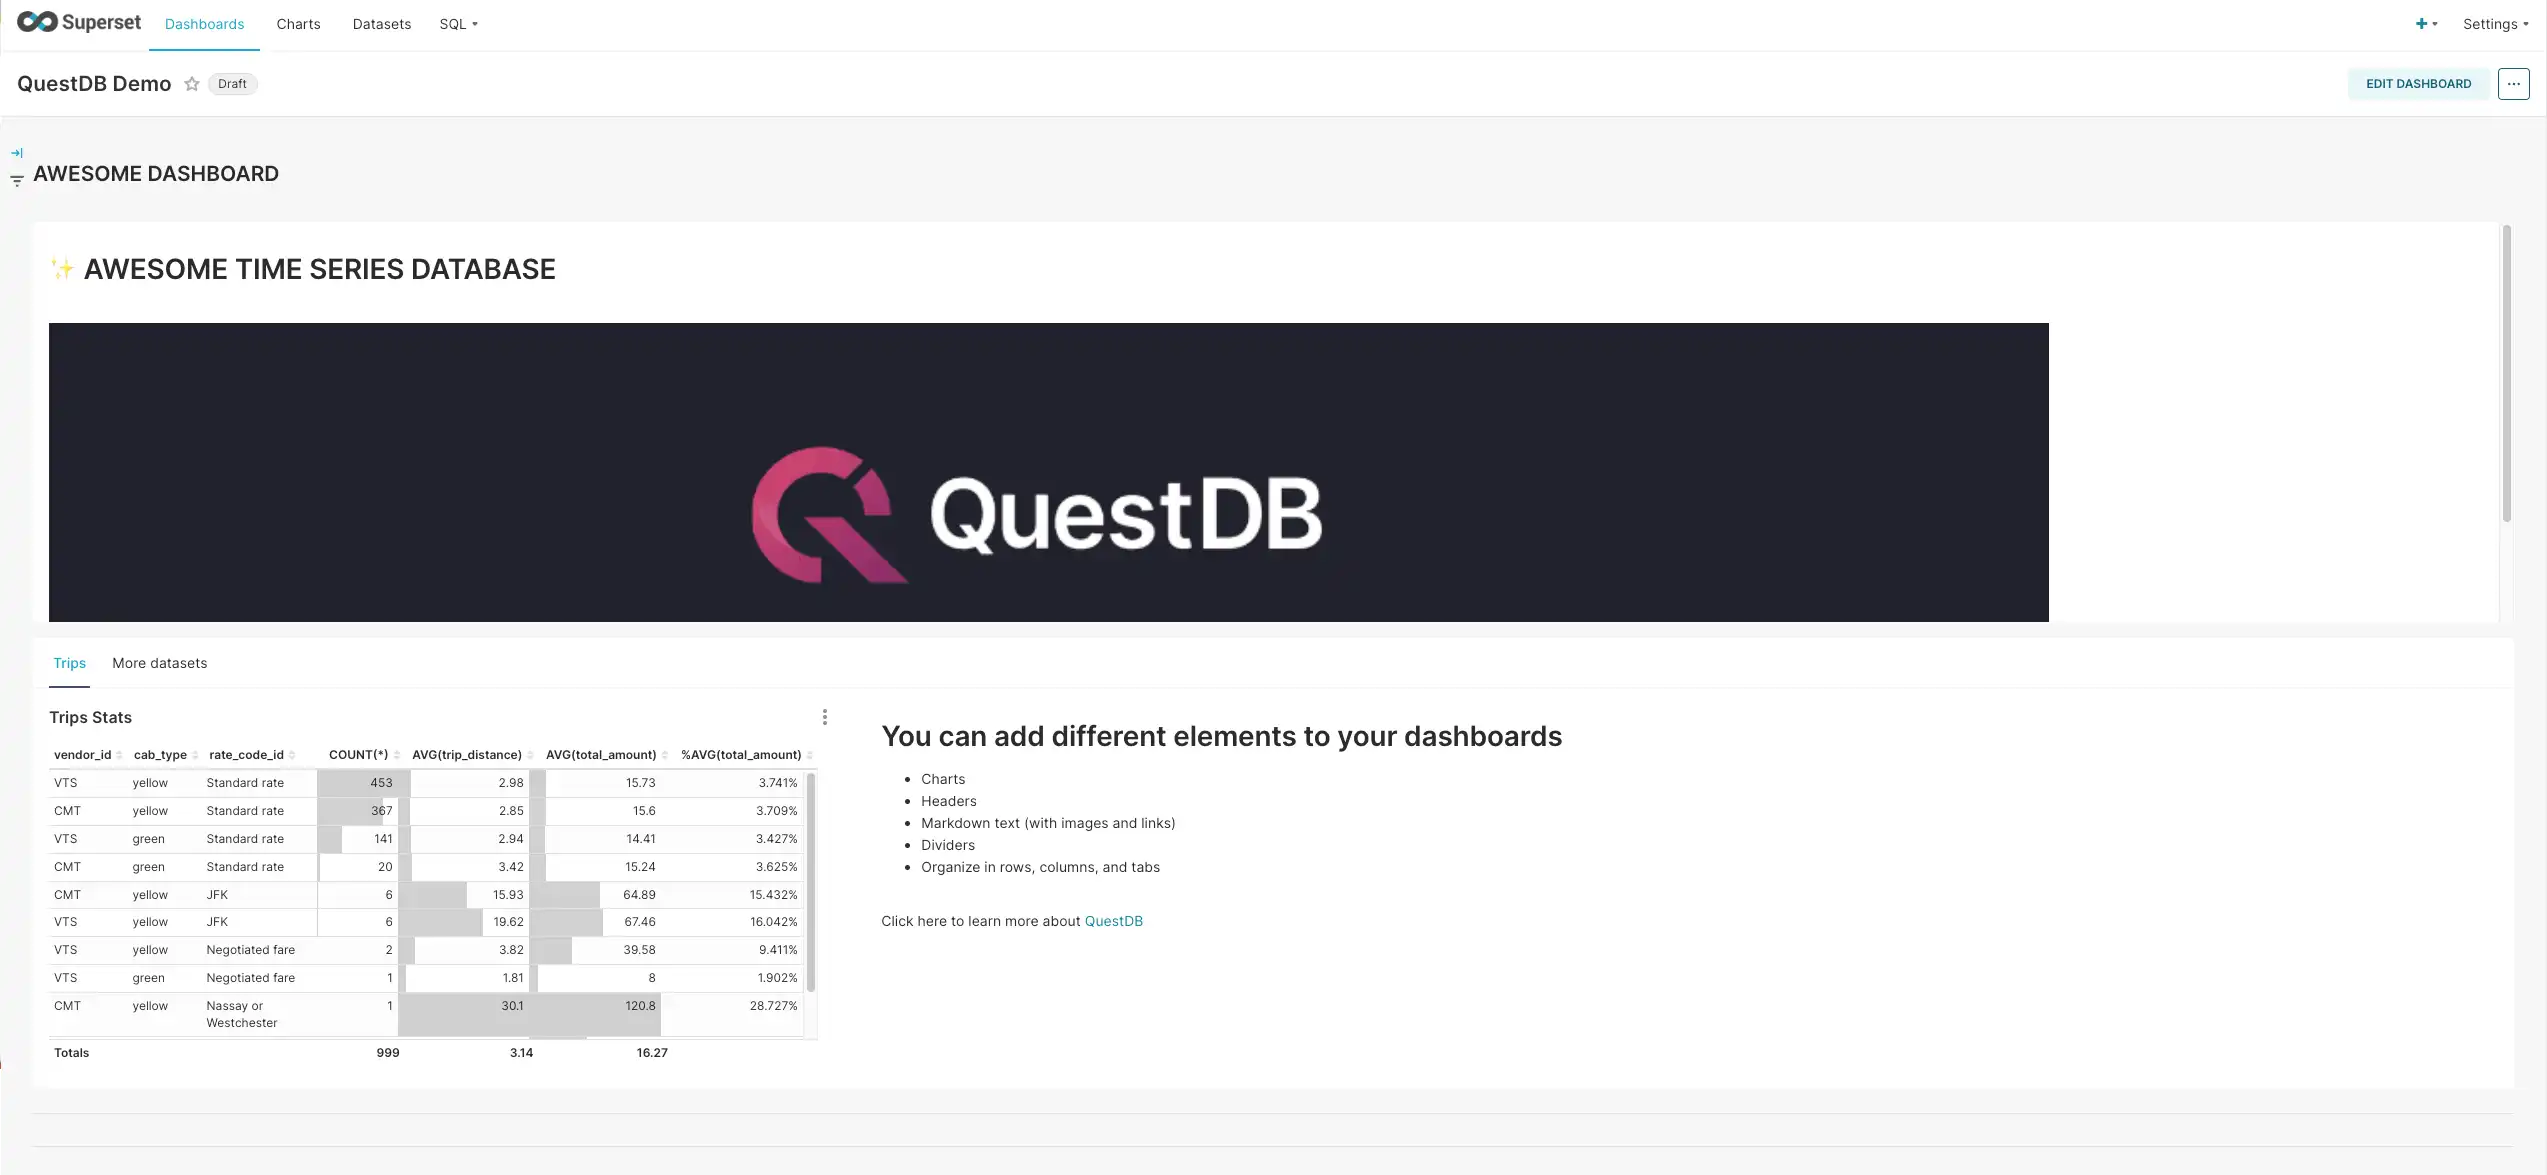
To save the chart, select SAVE in the top right. Choose a name (e.g., "Trips
Stats"), and the name of a new dashboard (e.g., "QuestDB Demo"). Click
SAVE AND GO TO DASHBOARD.
Congrats. You have just created your first chart and dashboard.
If you want to spice up the dashboard by adding headings, links, images, tabs,
dividers, etc., click EDIT DASHBOARD and play around with the layout. Check
the
Superset documentation
for more information.
Creating a dataset from a SQL statement
We will now add a new dataset, but in this case, we want to use QuestDB-specific
SQL, such as SAMPLE BY. We can do this by
creating a dataset from a SQL statement. Select SQL > SQL Lab and type the
following query in the SQL box:
SELECT timestamp, country_code, SUM(load_forecast) AS daily_forecast,SUM(load_actual) AS daily_actualFROM energy_2018SAMPLE BY 1d ALIGN TO CALENDAR;
Click RUN to see the results. The energy_2018 table contains data in
15-minute intervals, and we use SAMPLE BY to get the total usage and forecast
per day and country.
Click the arrow by the SAVE button, select SAVE DATASET, type the name
energy_sampled_1d, and then click SAVE AND EXPLORE.
You should now see the Chart dialog. Ignore any error messages you see on the
next screen, as they will disappear as we add some fields and update the chart.
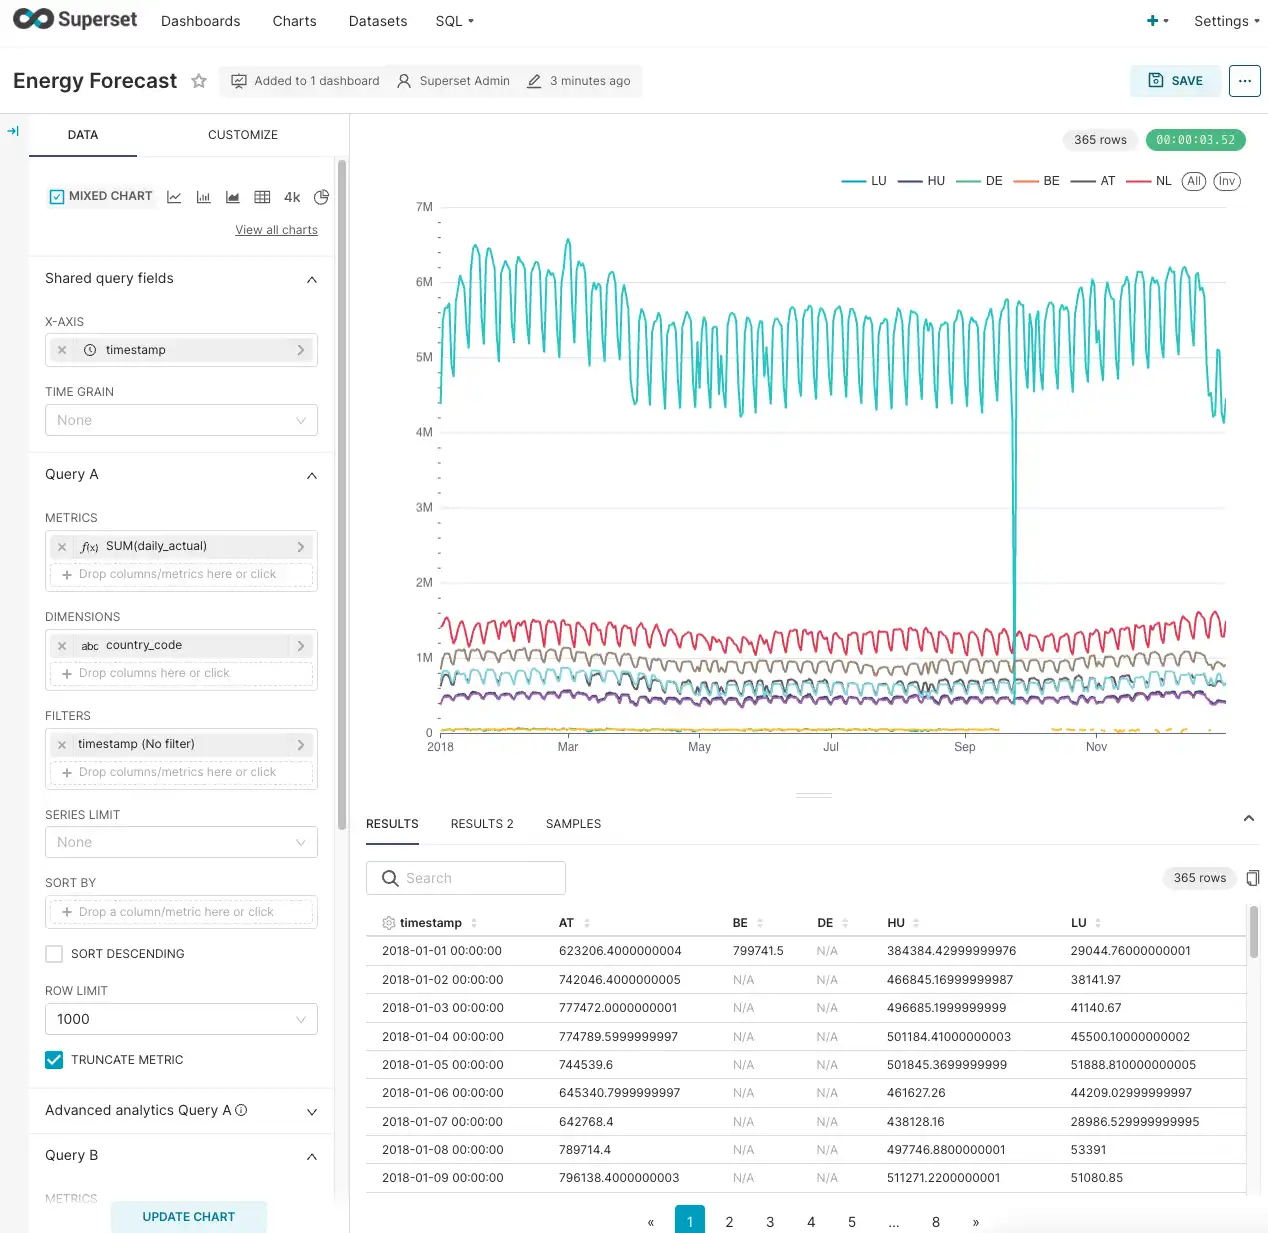
Click the view all charts link and look for the Mixed Chart type, which
allows us to represent line, bar, and area charts for different series on a
single chart. We will use it to plot the actual versus projected energy
consumption by country.
This time, the chart dialog has more options than before.
Let's select the timestamp column for the Shared query fields section,
SUM(daily_actual) as the Query A metric, country_code as the Query A
dimension, SUM(daily_forecast) as the Query B metric, and country_code as
the Query B dimension. Uncheck SORT DESCENDING for A and B queries, and
click UPDATE CHART.
If all goes well, you will see a line chart representing the energy data. Click
SAVE, name the chart (e.g., "Energy Forecast"), and add it to your existing
dashboard.
Wrapping up
Apache Superset is a complete tool for creating data visualizations. In this post, we have connected QuestDB to Apache Superset and added some basic charts. There are many more charts and options you can use.
The next step is to explore the Superset documentation. You can learn how to create business dashboards for both batch and real-time scenarios.
We encourage you to share some of your dashboards with our Community Forum. You can also play with our live demo to execute queries on demo datasets. Of course, contributions to our open-source projects on GitHub are more than welcome.