Complete overview of Tick Data (Examples)
Tick Data is the most granular form of market data available. It captures every price change, every trade, and every bid and ask update and provides a canonical view of the real market dynamic. In today’s hyper-accelerated financial markets, a deep understanding of Tick Data is essential to understand the broader market and for firms to maintain a competitive edge.
However, the complexity and volume of Tick Data can be daunting, even for seasoned computer scientists, let alone traders. We'll help get you up to speed.
Understanding Tick Data
Tick Data represents every individual trade or quote change in the financial markets. Unlike aggregated data like minute or daily bars, Tick Data captures each event as it happens. Each tick includes a timestamp, the bid and ask prices, and the trade volume.
This precise numerical data provides a detailed view of market activity.
For example, a single tick entry might look like this:
| Timestamp | Last Traded Price | Best Bid Price | Best Ask Price | Trade Volume |
|---|---|---|---|---|
| 2024-09-25 09:30:15.123 | 97.29 | 97.25 | 97.93 | 2000 |
The above example is considered "Level 1" Tick Data.
There are multiple levels (1, 2 & 3), and they are crucial to our understanding of Tick Data.
Level 1 vs. Level 2 vs. Level 3 Tick Data
We can represent the differences in level using a quick table:
| Level 1 data | Level 2 data | Level 3 data | |
|---|---|---|---|
| Market depth | Single best bid and ask prices | Multiple bid and ask prices at various levels | Full order book with individual order details |
| Information provided | Last traded price, best bid, best ask, volume | Aggregated bid and ask volumes across multiple price levels | Detailed information on each individual order |
| Use case | Quick snapshot of current market conditions | In-depth analysis of market liquidity and order flow | Advanced trading strategies requiring granular data |
| Volume of data | Lower | Higher | Highest |
| Typical users | Retail traders, basic trading strategies | Professional traders, high-frequency trading firms | Market makers, institutional traders |
Level 2 data example
In contrast to Level 1 data, indicated above, we have Level 2 data:
| Timestamp | Bid Level 1 | Bid Level 2 | Bid Level 3 | Ask Level 1 | Ask Level 2 | Ask Level 3 | Trade volume |
|---|---|---|---|---|---|---|---|
| 2024-09-25 09:30:15.123 | 97.25 | 97.24 | 97.23 | 97.93 | 97.94 | 97.95 | 2000 |
| 2024-09-25 09:30:15.124 | 97.26 | 97.25 | 97.24 | 97.94 | 97.95 | 97.96 | 2200 |
| 2024-09-25 09:30:15.125 | 97.27 | 97.26 | 97.25 | 97.95 | 97.96 | 97.97 | 2400 |
This table illustrates Level 2 data. It shows three levels of bid and ask prices along with their respective trade volumes. Unlike Level 1 data, which only provides the best bid and ask, Level 2 data offers a deeper view of the market. But do note that while it contains three levels of bid and ask prices, "level 3" data as a market data subset is a different classification.
Level 3 data example
In keeping with the trend, Level 3 data offers an even more granular perspective.
It includes details about each individual order:
- unique order IDs
- trader identities
- specific order quantities
This level of detail is valuable for market makers and institutional traders who need to analyze the behavior of specific market participants, such as watching certain hedge funds or similar.
| Timestamp | Order ID | Bid/Ask | Price | Quantity | Trader ID |
|---|---|---|---|---|---|
| 2024-09-25 09:30:15.123 | 1001 | Bid | 97.25 | 500 | TraderX |
| 2024-09-25 09:30:15.124 | 1002 | Ask | 97.93 | 300 | TraderY |
| 2024-09-25 09:30:15.125 | 1003 | Bid | 97.24 | 200 | TraderZ |
Note: Level 3 includes individual order details which are excluded for brevity.
Tick Data as time-series data
What all levels of data have in common is that they are classified as time-series data. This means that the data is always linked to a clear timestamp. Time-series data has its own set of unique requirements, and often requires a specialized time-series database for storage.
To learn more about time-series data, see our blog.
We'll cover storage in a later section, but for now, let's consider how market tick data relates to a firm's order book.
How Tick Data ties into an order book
Tick Data is directly related to the order book, which lists all buy and sell orders for a particular asset. Each tick represents a change in the order book, whether it's a new order, a canceled order, or a trade execution. It shows the flow of buy and sell orders, liquidity, and can help a firm with their overall order strategies. In other words, an order book is made up of "ticks" from Tick Data.
The order book as a whole is a treasure trove of insights. However, getting to these insights requires advanced methodologies, empowered by deep algorithms and cutting-edge software. Across the entire, broad market, it's a dizzying dance of information to manage:

Where does Tick Data originate?
Tick Data is sourced from various providers such as Bloomberg, TickData.com, among others. These providers offer data via APIs, direct data feeds, and via other aggregators such as Data Bento. It is often very expensive, and that price increases depending on the speed in which the data is generated.
From Bloomberg's own article outlining the technical complexity of their market data:
"Every piece of market data is about the size of a tweet, but there are millions of them per second at the peaks of the day. We have to take these and flow them through various processing steps. We need to turn them into a standard form internally so we can distribute them. We need to store them. We may need to make some calculations on them. Once we have that, we need to route them out around the world to customers. And this entire process needs to happen in microseconds." - Paul Callaway, Head of Real-Time Systems, Bloomberg
Bloomberg is wired in right at the exchange terminal. This means when trades are executed in the NYSE or NASDAQ, Bloomberg is first off the block with the Tick Data representing the trade. Then, they, and other firms in similar advantaged positions, route and package the Tick Data for dispersal throughout the retail market. But before that, other firms apply whatever means they can to get ahead of the retail wave.
What about historical Tick Data and storage?
We've looked at how Tick Data is composed and from where it originates. But what about how it is captured and stored?
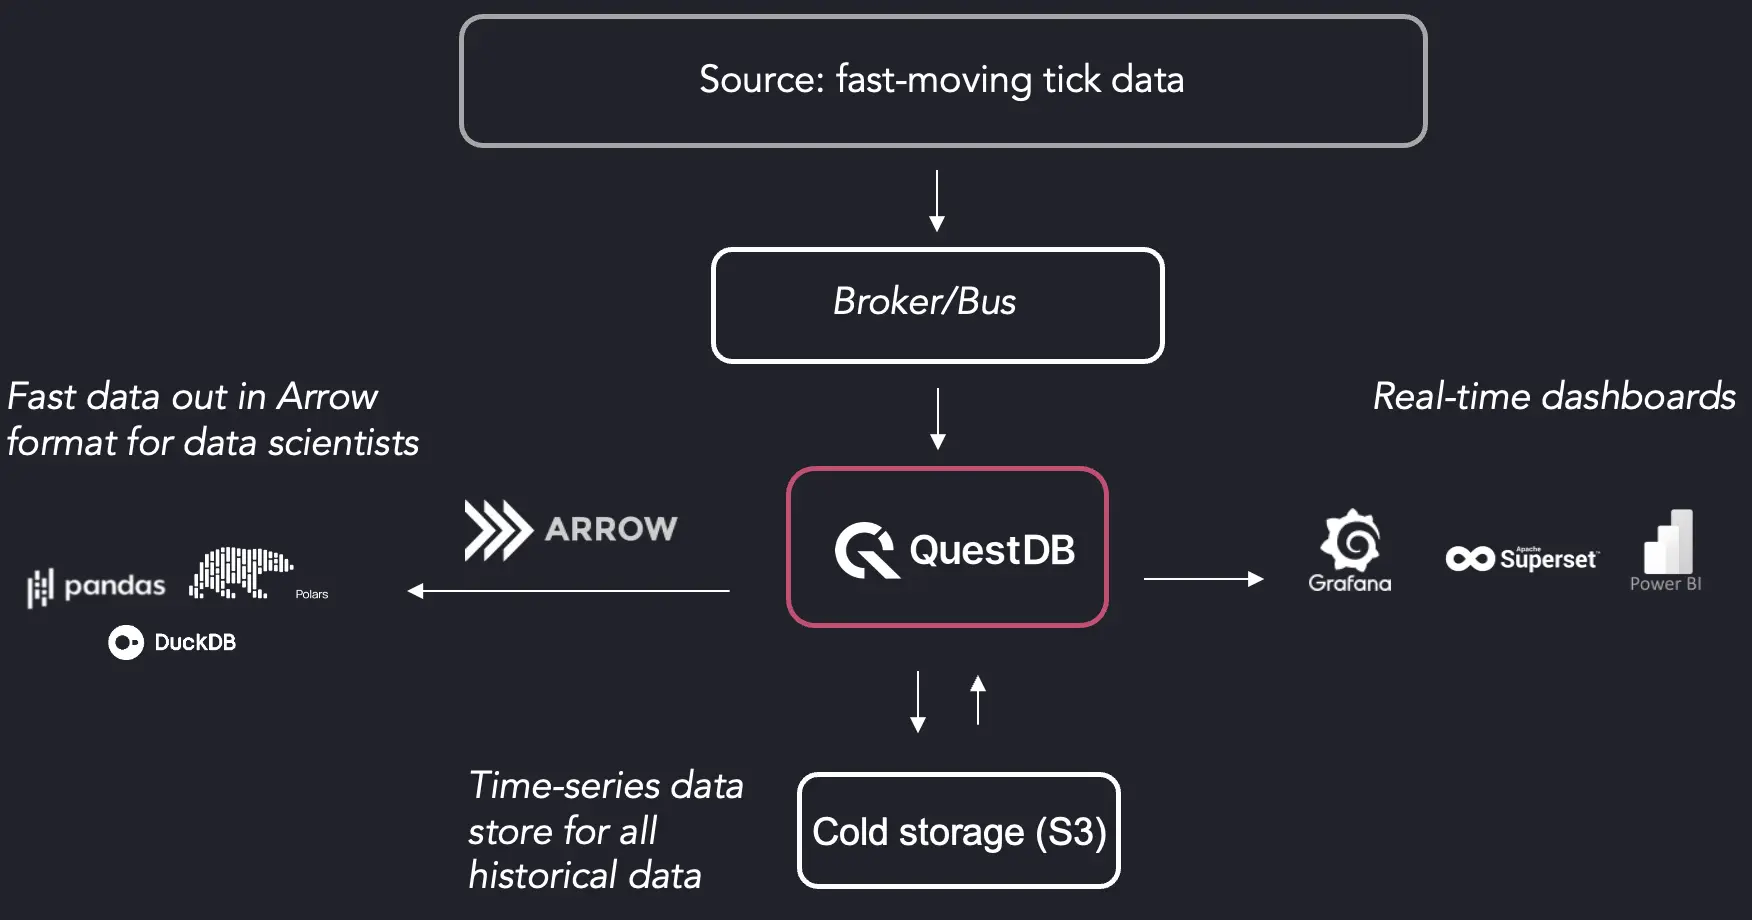
Tick Data storage requires robust databases designed for high-speed writes and rapid retrieval. There's also the balance in storing hot Tick Data (for reading/writing) or cold Tick Data (for longer-term archival, compliance, reporting, and querying). As mentioned above, it's all time-series data.
Time-series databases like kdb+ and QuestDB are popular choices due to their ability to handle large volumes of time-stamped data. Data compression techniques, such as columnar storage and delta encoding, reduce storage requirements without sacrificing accessibility. In the case of QuestDB, native Apache Parquet support gives compression via an open format out-of-the-box.
While kdb+ has been the strongest performers within financial data for years, the sheer demand on these systems for all aspects of ingestion, querying, and algorithmic analysis, has skyrocketed. As such, next-generation financial databases like QuestDB provide simplified SQL-based querying syntax and extremely efficient hardware performance profiles. This enables technologists to "ride the wave" of vast data flows without getting crushed on costs or left behind by more advanced competitors.
As such, it's a balance between accessibility, performance and cost. Traditional Tick Data storage is known for its great performance, but also for its vendor lock-in and usage of proprietary formats. The new wave is all about open formats, for easier interoperability to other toolsets, without any compromise towards performance.
How is Tick Data analyzed?
There are countless ways to analyze Tick Data. We'll use two broad buckets.
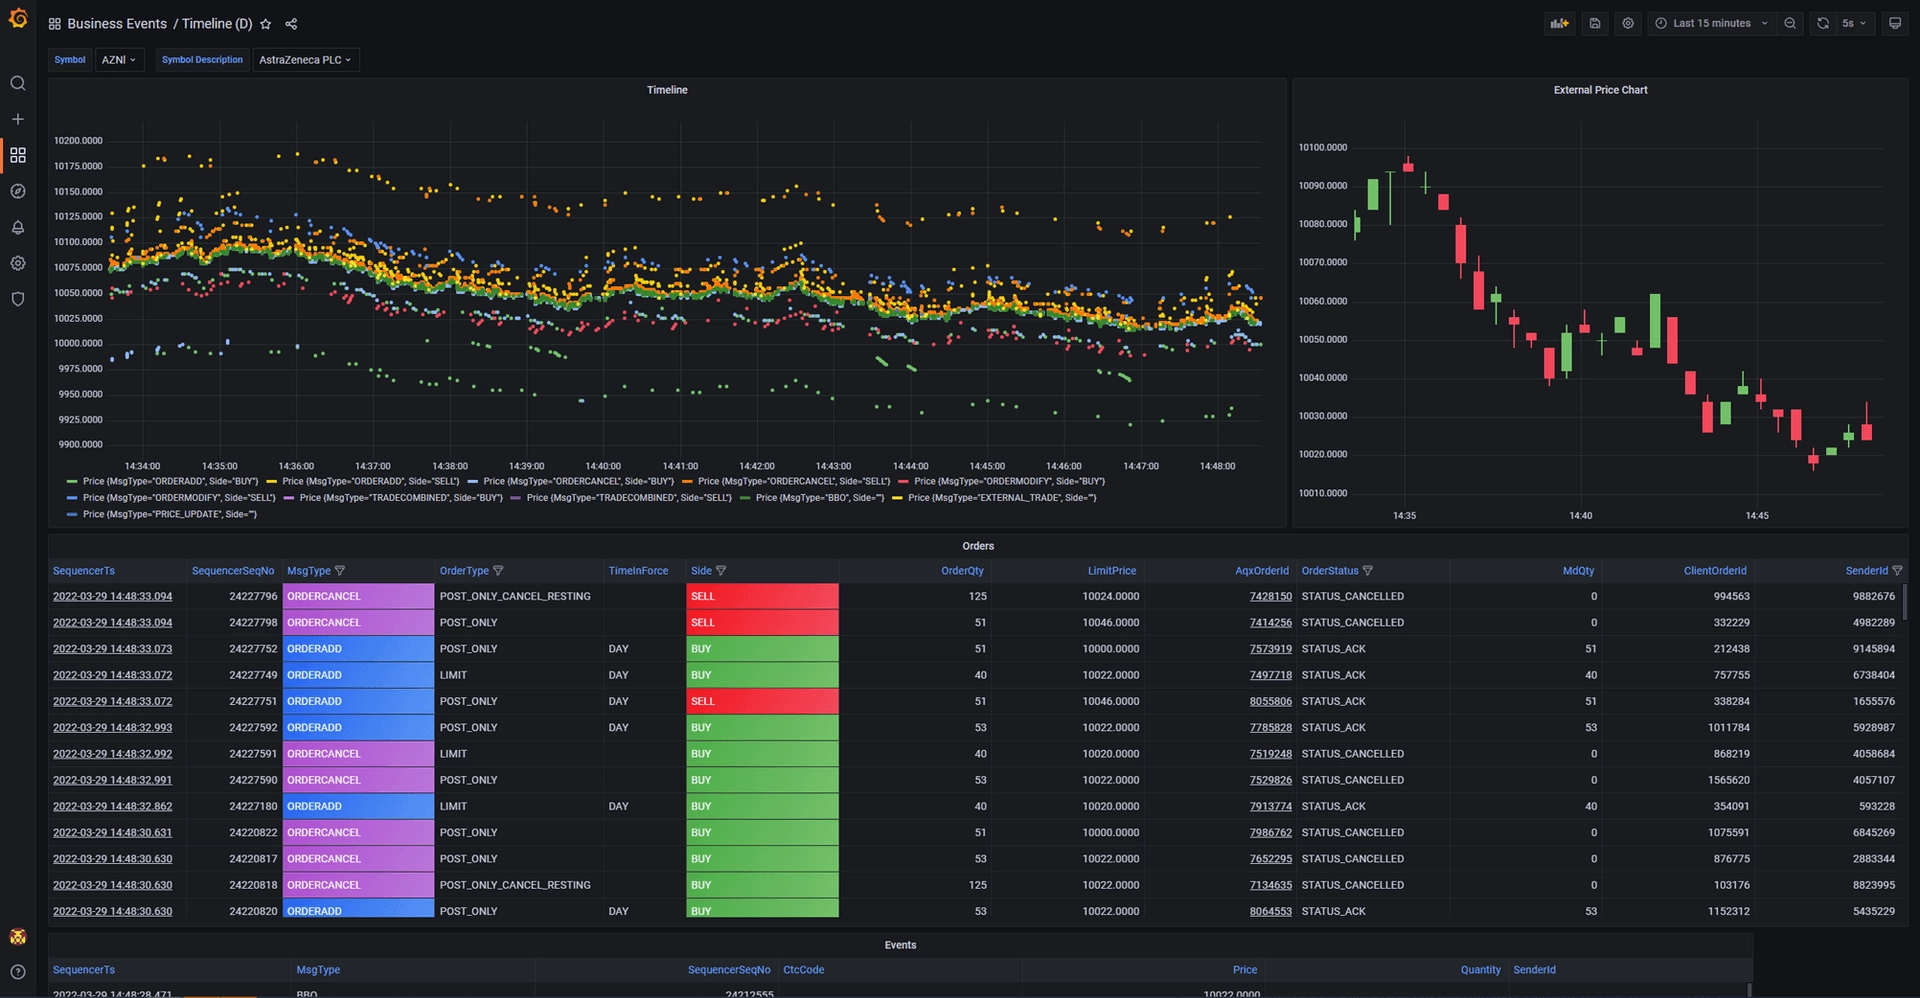
The first is visualization. The stereotypical traders computer contains multiple monitors filled with dancing charts. These charts are provided by tools such as Grafana, which query and underlying database to get dynamic visual information.
And then there's the algorithmic side. Algorithmic methods and secrets are guarded carefully. Great sums of money are spent on R&D to find them.
Visualizations and dashboards
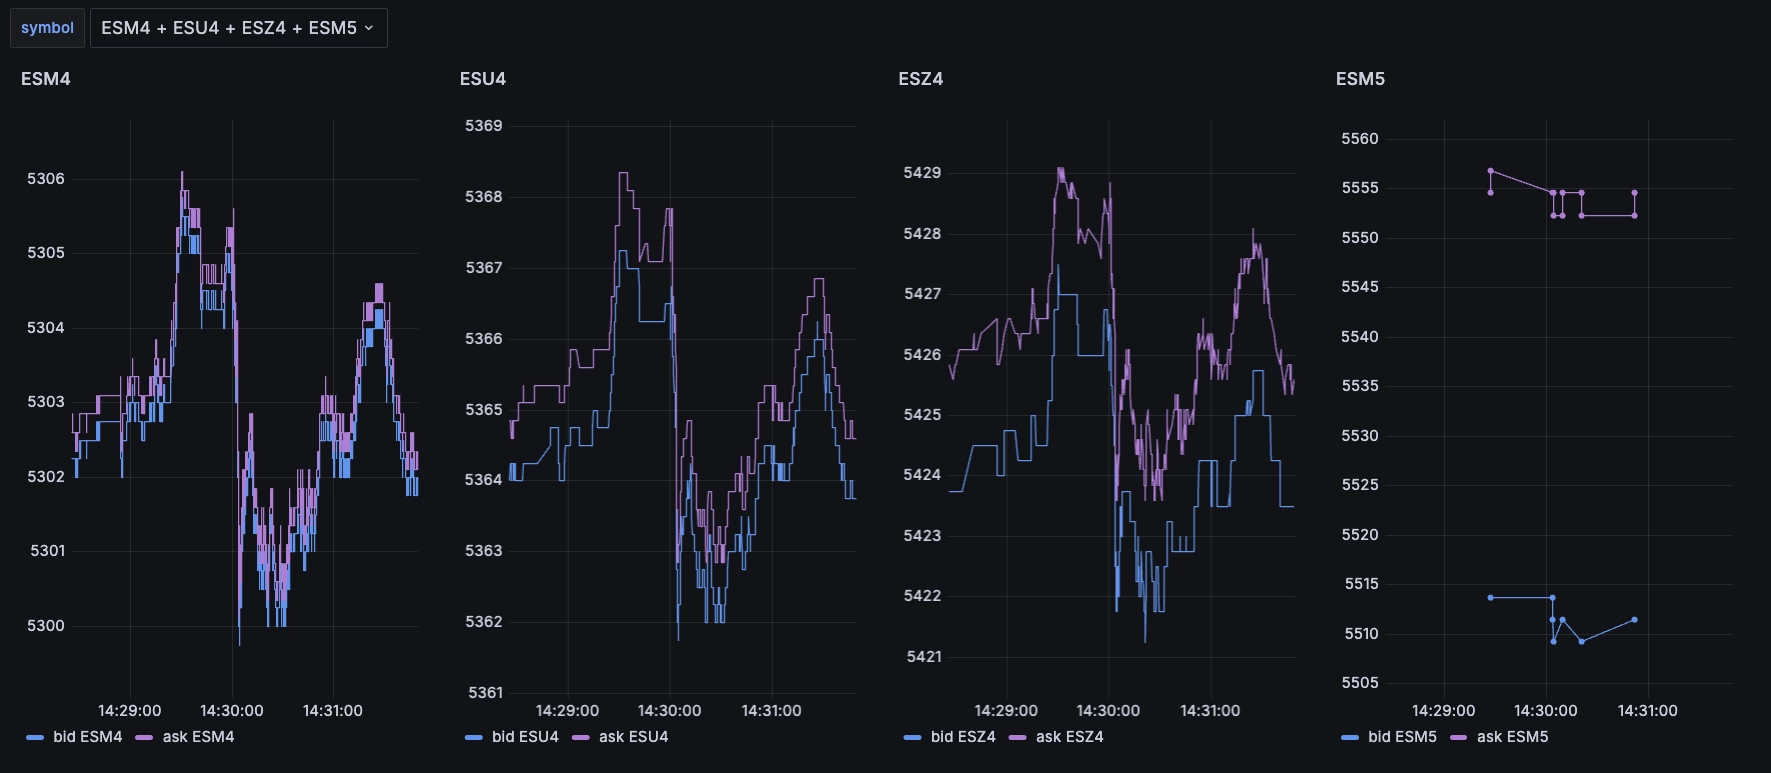
Firms may embark on descriptive analytics, and calculate averages, medians, and then visualize trends:
There are many visual analysis styles. They're useful for reporting on information, but less so for making "immediate" trading decisions. One might visually analyze a trend for an opportunity, then have that opportunity interpreted by an algorithm for a deeper determination on the quality of the proposed strategy.
Algorithmic analysis
A common example of algorithms in trading are those applied to high-frequency trading (HFT). Occurring at a rate faster than possible human responses, HFT leverages machine speed to rapidly identify and capitalize on emerging trends.
How rapid?
Consider this Investopedia image, which shows the potential of a mere 50ms:
:max_bytes(150000):strip_icc()/dotdash_Final_The_World_of_High_Frequency_Algorithmic_Trading_Feb_2020-03-7fe7af307f694e438ad3833456ed5c63.jpg)
This sort of trading relies on the development of very sophisticated algorithms, often supported by machine-learning and increasingly "AI" workflows. These applications require fast streams of up-to-date Tick Data for their accuracy and efficiency. And furthermore, the methods are not possible without the latest, cutting-edge technologies for Tick Data storage and analysis.
At the end of the day, in most trading houses, it's common to see sophisticated dashboards, such as those like the above item created by Grafana. Or, to have software applications capable of making intelligent decisions. In either case, these tools consume Tick Data, and both of them rely on effective consumption and storage of Tick Data via advanced software applications.
Summary
Tick Data, both current Tick Data and historical Tick Data, is the heartbeat and blood flow of modern financial markets. Throughout this blog, we explored its definition, sources, storage, and the intricate processes involved in handling it. We delved into how Tick Data powers high-frequency trading, enhances market microstructure analysis, and strengthens risk management and compliance.
As technology advances, machine learning and artificial intelligence are poised to further transform how we analyze and utilize Tick Data, opening new avenues for innovation. For computer scientists and finance professionals alike, mastering the fundamentals of Tick Data is essential.