Real-time stock price alerts using Python, Grafana and QuestDB
This submission comes from one of our community contributors Kovid Rathee who has written a great guide for setting up alerting via Grafana.
Thanks for your contribution, Kovid!
Introduction
There are many reasons why reacting to time series data is useful, and the quicker you can respond to changes in this data, the better. The best tool for this job is easily a time series database, a type of database designed to write and read large amounts of measurements that change over time.
In this tutorial, you will learn how to read data from a REST API and stream it to QuestDB, an open-source time series database. We will use Grafana to visualize the data and notify Slack of changes that interest us. We use Python to fetch data from the API and stream it to QuestDB, and you can easily customize the scripts to check different stocks or even APIs.
Prerequisites
Before getting started with the tutorial, you will need the following:
- Docker to run Grafana and QuestDB with Docker Compose
- IexFinance account, which offers a free tier for 50,000 API calls per month to poll stock prices
- Slack workspace (optional)
The Python example in this tutorial uses
real-time price for a stock,
using the last trade on IEX. Prices outside of market hours can be retrieved
from the extendedPrice field from the Quote endpoint. For more information,
see the IexCloud quote endpoint
This tutorial uses Slack as an example notification channel to deliver alerts via Grafana, but it's simple to choose another channel you would like alerts delivered to, such as your own REST API via webhook, Kafka, email, Pagerduty and more. For more details on the available notification channels, see the Grafana documentation for the list of supported notifiers.
Start QuestDB and Grafana
To clone the GitHub repository and start the example project:
git clone https://github.com/questdb/questdb-slack-grafana-alerts.gitcd questdb-slack-grafana-alertsdocker-compose up
Running docker-compose up brings up two networked containers:
- Grafana on http://localhost:3000
- QuestDB on http://localhost:9000 as well as a port
open on
8812, which accepts Postgres wire protocol
Running docker-compose up will also
provision Grafana
with the default connection credentials to QuestDB for Postgres authentication.
By provisioning credentials, you can use QuestDB as a default data source in
Grafana right away without manual configuration steps.
Verify QuestDB and Grafana are running by visiting the URLs listed above or use
docker-compose ps from the repository root which will show you the running
containers:
Name Command State Ports------------------------------------------------------------------------------------------------------------------grafana_alerts /run.sh Up 0.0.0.0:3000->3000/tcpquestdb_alerts /app/bin/java --add-export ... Up 0.0.0.0:8812->8812/tcp, 0.0.0.0:9000->9000/tcp, 9009/tcp
Send data to QuestDB
The Python dependencies required for this tutorial are provided in the
requirements.txt file and can be installed using pip:
pip install -r requirements.txt
We will use the IexFinance API to fetch real-time stock prices, but first, we can verify the configuration is correct by using a test script that generates dummy data. The mock script generates random prices so that we don't deplete the API call limit during testing.
To start sending mock data to QuestDB, run the mock data script in the python
directory:
cd pythonpython mock_stock_data_example.py
The script will create a table stock_prices, and it will start sending mock
data to this table. The columns that we have are:
| column | description |
|---|---|
stockListed | name of the stock, e.g., TSLA for Tesla |
stockPrice | price of the stock in USD as double |
createdDateTime | timestamp at which stockPrice was ingested in QuestDB |
One feature of QuestDB that we are using for the stock name is the symbol data
type optimized for text columns with repetitive values. More information on this
type can be found on the QuestDB
documentation for symbol type.
To verify if data is arriving in QuestDB:
- Navigate to http://localhost:9000
- Run the following query:
SELECT * FROM stock_prices;
We should see all rows from our table returned at the bottom panel:
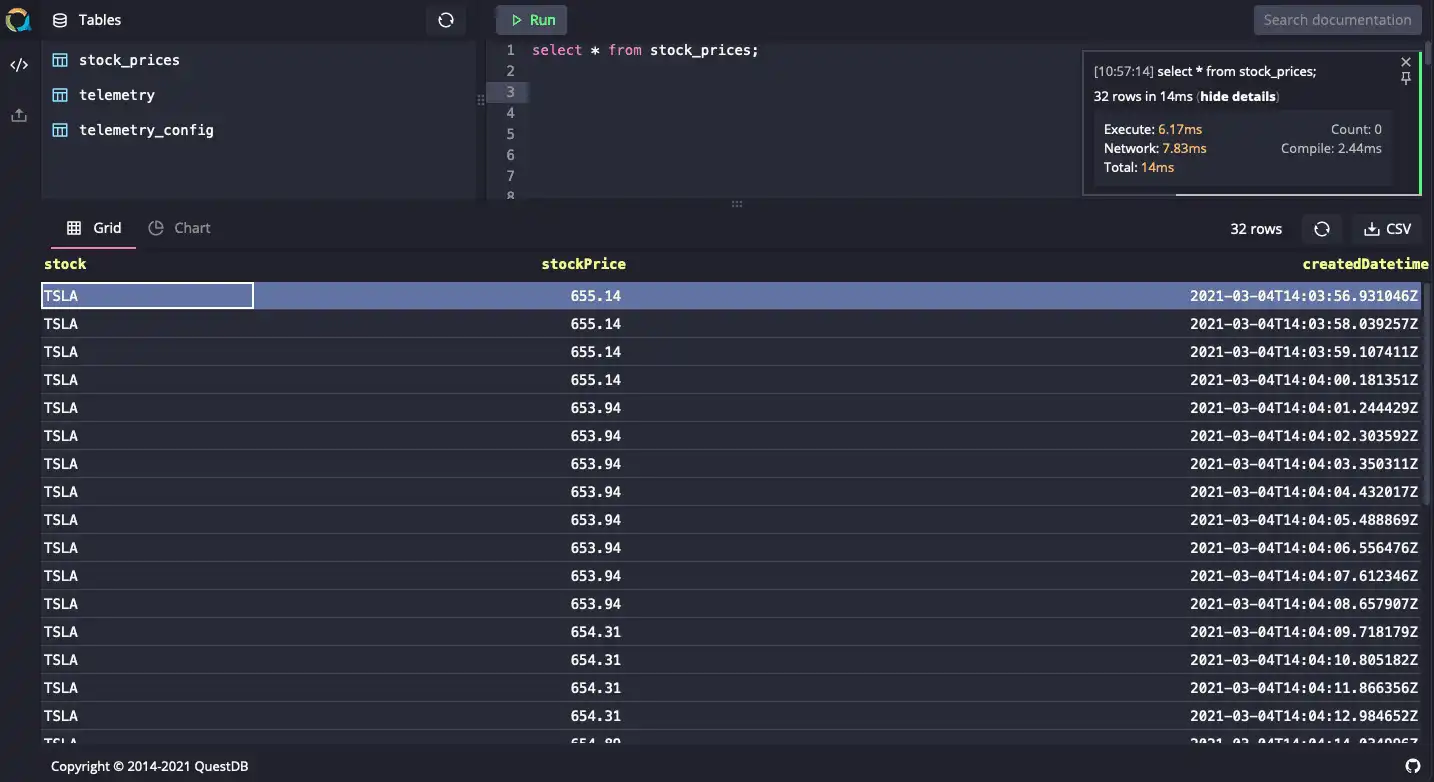
Query real-time stock prices
Once you have tested the ingestion using the mock data script, we can start making requests to an API for live market data and query real-time stock prices. To configure IexFinance API authentication:
- On the IexFinance console, create an API token
- Click Reveal Secret Token and copy the value
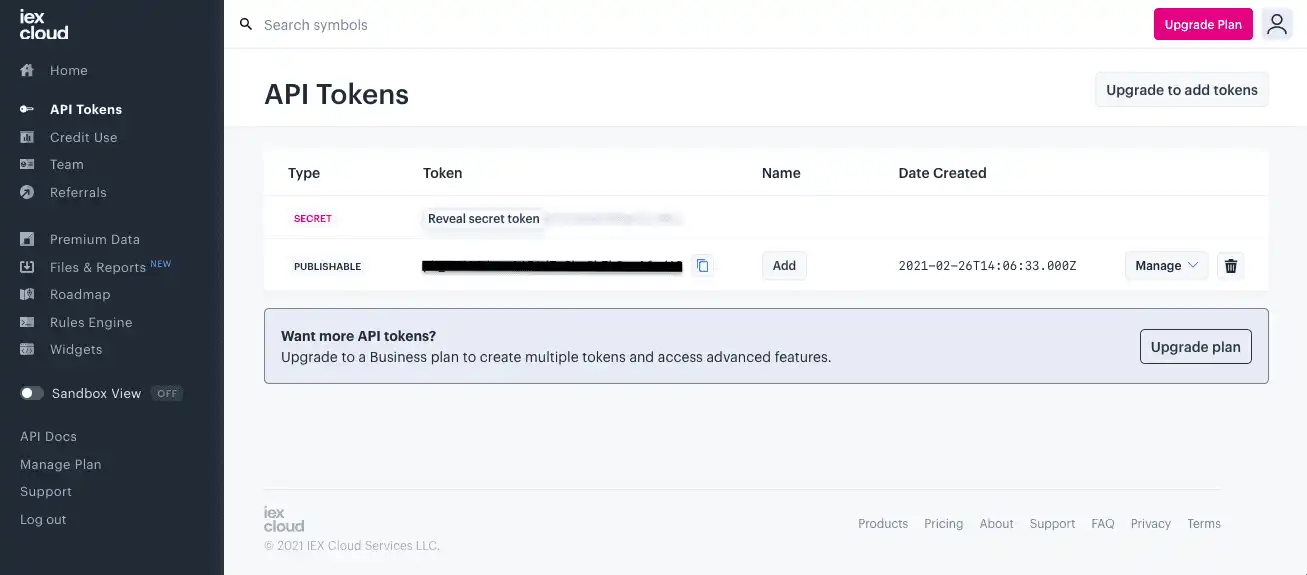
Now we can add this token to our project, so the Python scripts have
programmatic access to the IexFinance API. To store project secrets, we are
using the Python dotenv package,
which allows passing configuration to Python scripts as environment variables.
We can explicitly pass a token to each API call to IexFinance, or we can use the
IEX_TOKEN environment variable that the Python library will check implicitly.
To add the token:
- Create a new file
./python/.env - Paste the token in the
.envfile in the formatIEX_TOKEN=Skwf93hD... - Run the live market data example:
cd pythonpython stock_data_TSLA_example.py
If the markets are open, real-time prices will be sent to QuestDB:
Inserting rows into table 'stock_prices' - press Ctrl-C to stopInserting into 'stock_prices': TSLA 673.58 2021-03-10 12:37:23.147258...
Slack incoming webhook
The next step is to create an incoming webhook in Slack to send alerts as HTTP(S) requests from Grafana. To set up the webhook:
- Navigate to the create a new Slack app page and create an app called Price Alerts for your workspace
- Click Incoming Webhooks in the features section
- Activate incoming webhooks and click Add New Webhook to Workspace
- Select the Slack channel you want to receive alerts in and click Allow
- Copy the Webhook URL which is in the following format
https://hooks.slack.com/services/T123/B0123/2Fb...
Grafana notification channels
The final step in connecting Slack and Grafana is to create a notification channel. To configure a Slack notification channel to send alerts to:
- Log in to Grafana at http://localhost:3000 using the default credentials:
user:adminpass:admin
- Navigate to http://localhost:3000/alerting/notifications and click Add channel
- Give it the name Stock Price Alert and choose the
Slacktype - Paste the webhook URL in the Url field
- In the Notification settings dropdown, enable the Include image checkbox
- Click Test to verify that the configuration is correct and then click Save
Your Slack workspace should display a test notification coming from Grafana:
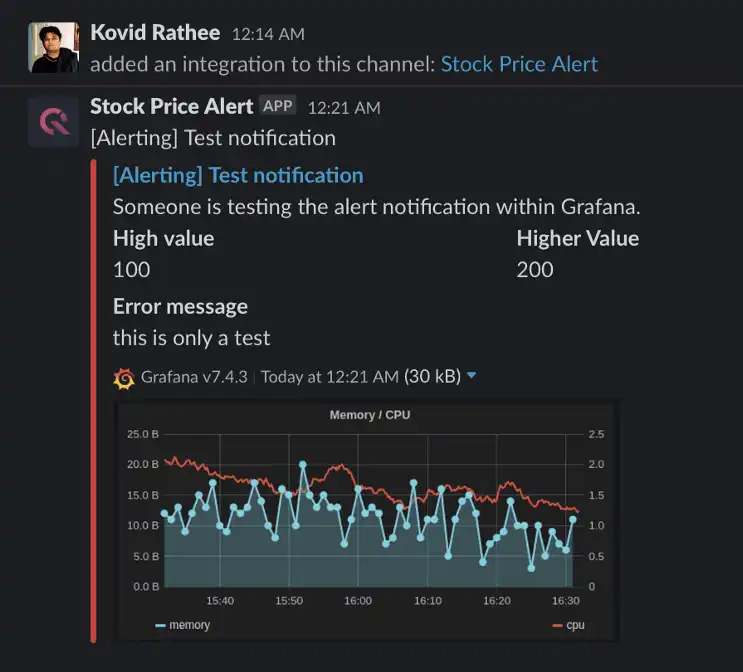
Grafana alerts
Next up, we can create a new panel on Grafana and configure alerts based on queries we're interested in:
- Navigate to http://localhost:3000/dashboard/new and click + Add new panel
- In the Query panel, click the pencil icon or click Edit SQL
- Paste the following example query
SELECT createdDatetime time,round(avg(stockPrice),2) avgPriceFROM stock_pricesWHERE stock = 'TSLA'SAMPLE BY 5s;
We now have a visualization of five-second averages of Tesla's stock price:
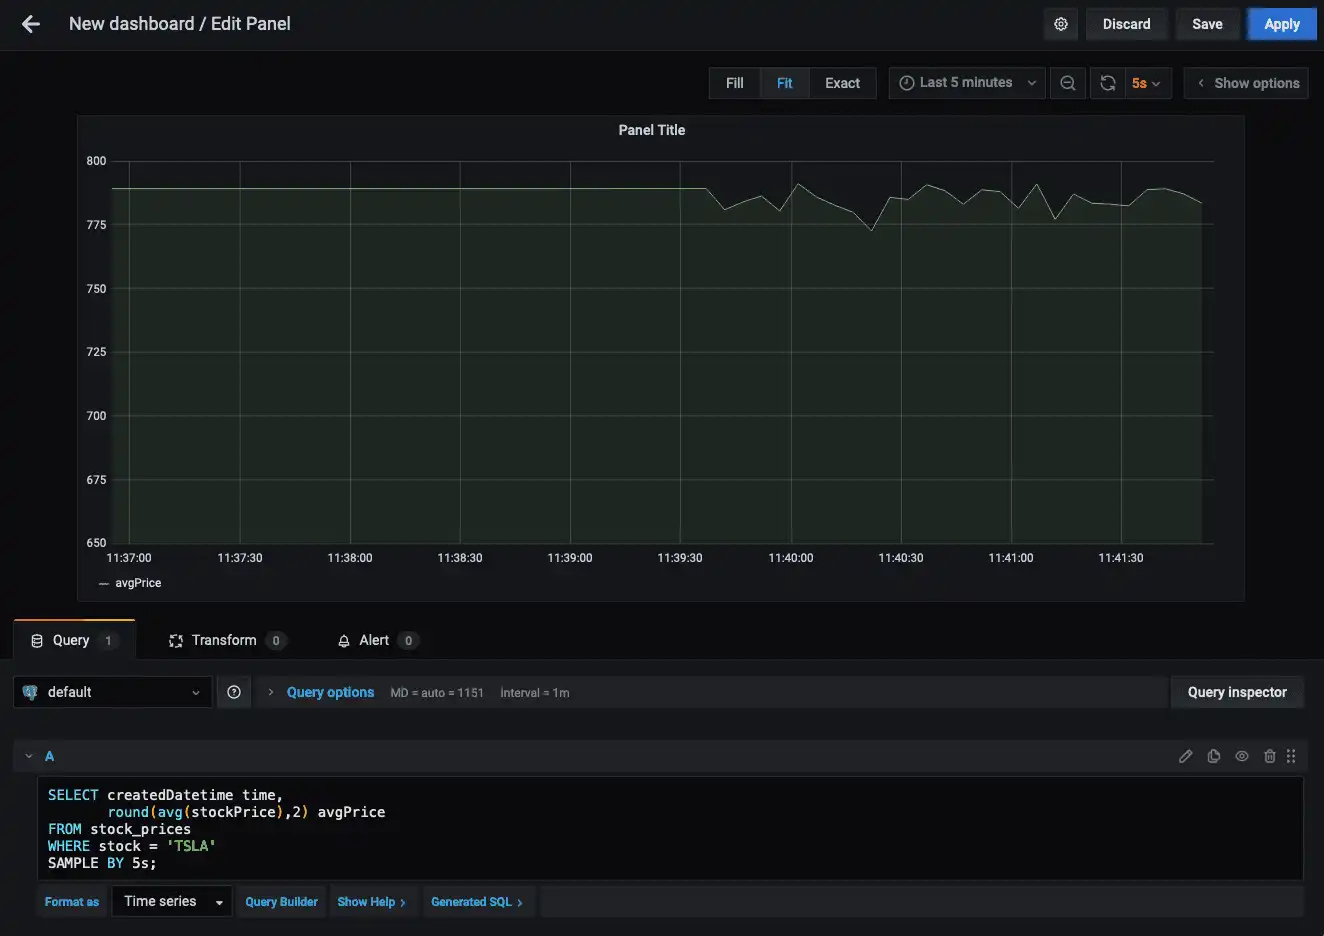
To make sure we don't lose our visualization panel, click Save and give the dashboard a name of our choice.
Rules and conditions
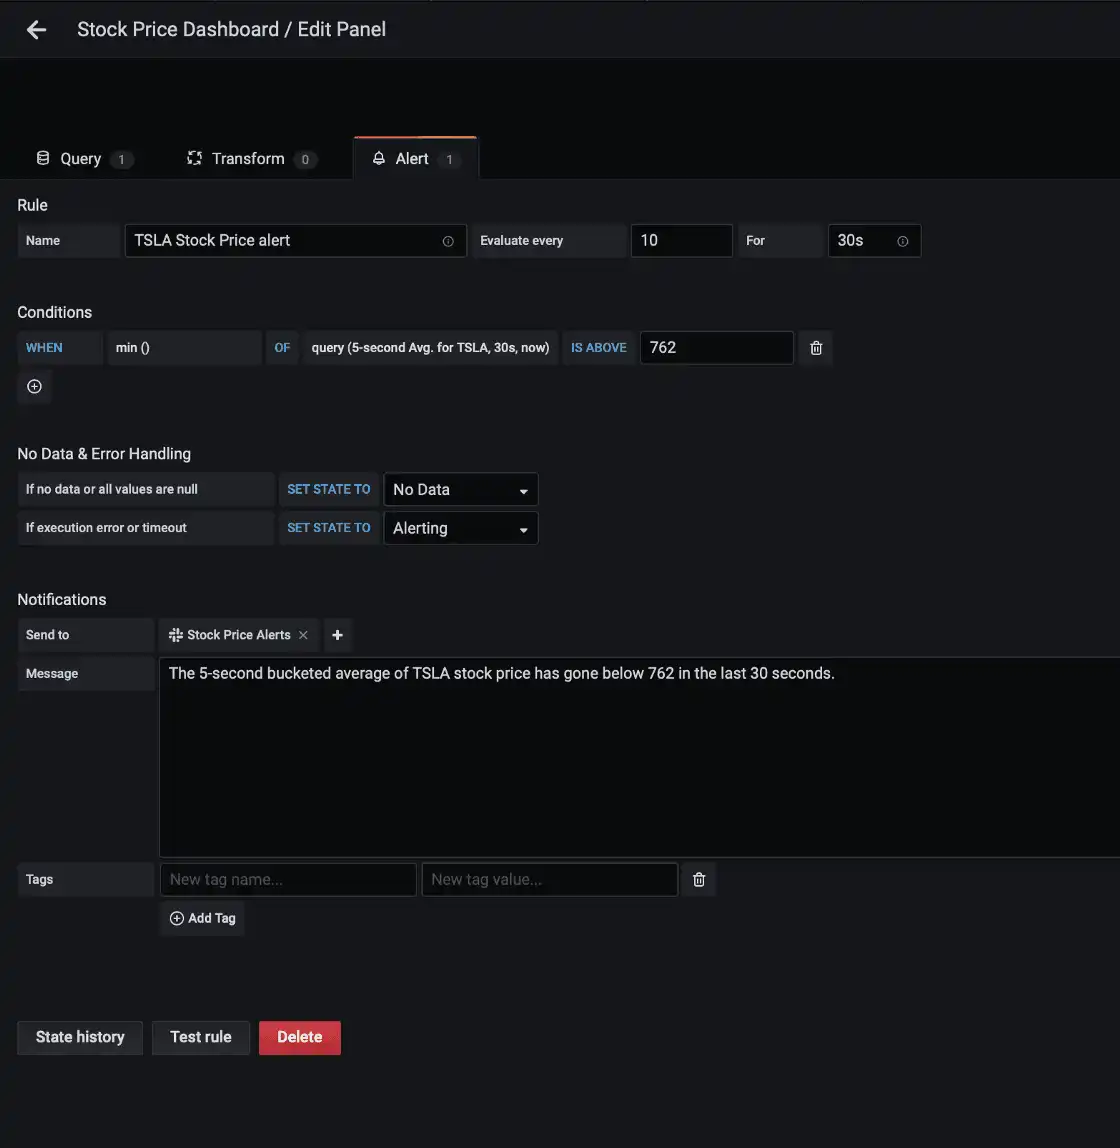
To understand how alerts work, let's take a brief look at the concepts. The two main components for setting up alerts are the alert Rule and Conditions.
The Rule has the following settings:
Nameto give the alert a descriptive titleEvaluate everyis how often the scheduler will evaluate the alert ruleforspecifies how long the query needs to violate the thresholds before triggering alert notifications
The Conditions section has the following settings:
WHENsets an aggregate function on a seriesOFis the query to alert on over a time range in the formatquery(query_name, from, until)IS ...allows specifying a comparison to a value or range
For more information on the conditions of alerting, see the Grafana alert conditions documentation.
Create an alert
The example alert we are using in this tutorial will be triggered if the minimum
value of the query named 5-second Avg. of TSLA is below 762, and we will set
the time range for alerting to the last thirty seconds. To set up this alert:
- Edit the query and select the Alert tab
- Click Create Alert and give it the name
Tesla Stock Price alert - In the Rule section:
- Set Evaluate every to
10 seconds - Set for to
30 seconds
- Set Evaluate every to
- In the Conditions section:
- Set WHEN to
min() - Set OF to
query(5-second Avg. of TSLA, 30s, now()) - Click IS ABOVE, change this to IS BELOW, and set the value to
762
- Set WHEN to
- Use the default values in the No Data & Error Handling section
- In Notifications -> Send to, choose the
Stock Price Alertsnotification channel - Add an optional message to be delivered with the alert
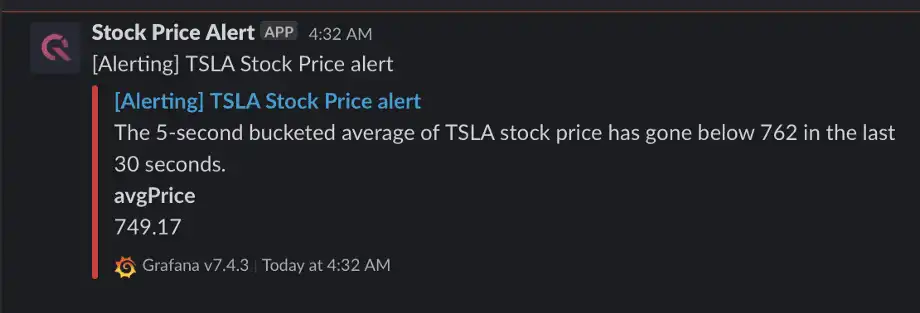
When the conditions of the alert are met, we will see Slack notifications arriving in the channel that we have configured:
Summary
In this tutorial, we've shown how Grafana and QuestDB can be quite powerful for data visualization and alerting. We learned how to ingest live ticker data from a REST API into QuestDB and how to visualize this data in a Grafana dashboard and set up alerts based on predefined conditions.
The next steps for improvements to the Python scripts could be command-line arguments for multiple stock symbols, and better error handling if markets are not open. Feel free to submit a PR if you have a suggestion or improvements to make!
If you like this content, we'd love to know your thoughts! Feel free to share your feedback or just come and say hello in the community forums.