Analyzing the beautiful charts and history behind ECB FX rates
The European Central Bank (ECB) is the central bank for the euro. The ECB administers monetary policy within the Eurozone, which consists of 19 of the 27 member states of the European Union that have adopted the euro as their common currency.
In this article, we'll look at the historical ECB foreign exchange (FX) rates dataset and analyze it over-time. You'll enjoy it if you have an interest in foreign currency exchange, history or finance in general. And also if you have an affinity for pretty charts.
The beauty of a good chart
In our previous post about managing Grafana variables, we imported and used the ECB currency fixing historical dataset as our example data.
This data is quite different from the data we would typically look at because:
- (a) it's a much lower frequency - one price per day
- (b) the timeframe is much larger - decades
This means that this dataset contains a lot of history. In retrospect, did major world events have an impact on these rates? To answer this question, we picked a few historical events. The history is not only interesting, it also leads to some beautiful charts!
Building from the data
We'll break our analysis down into a few key parts.
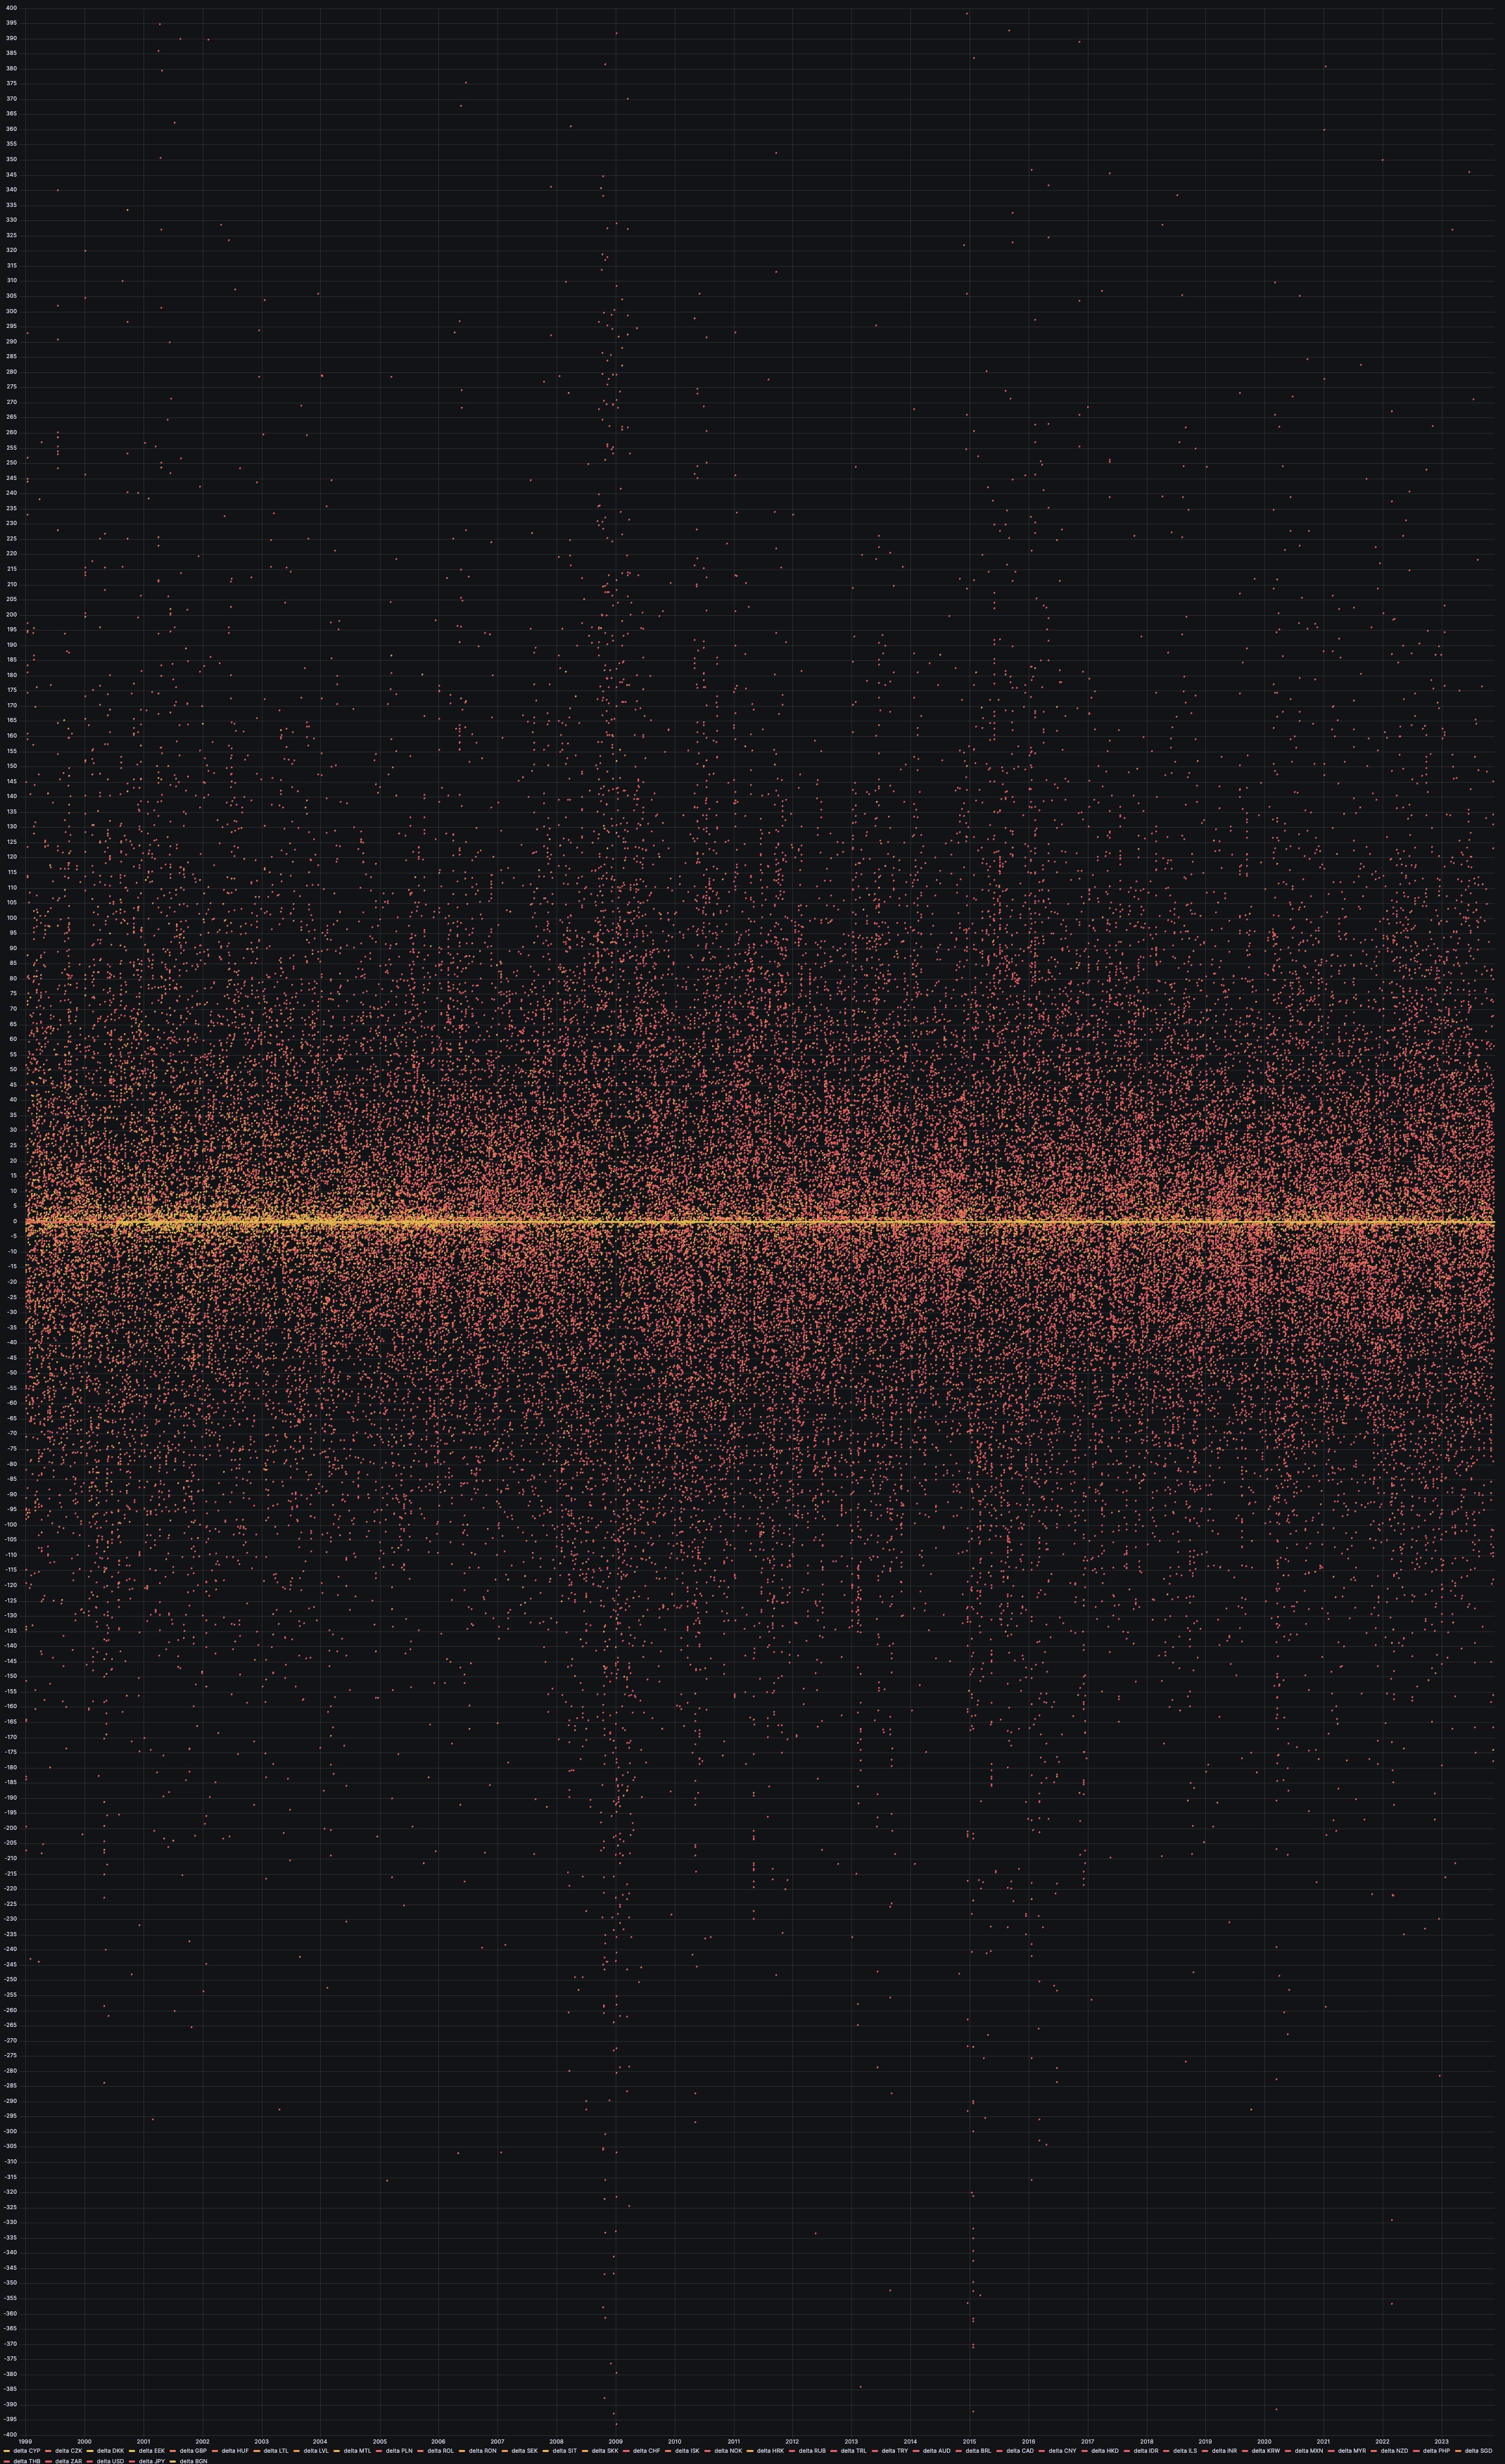
Price change overview
The first way we can look at these prices is through a change-based approach. For example, we can look at the day-to-day change in percentage terms. What's interesting about this representation is that it highlights significant events pretty clearly:
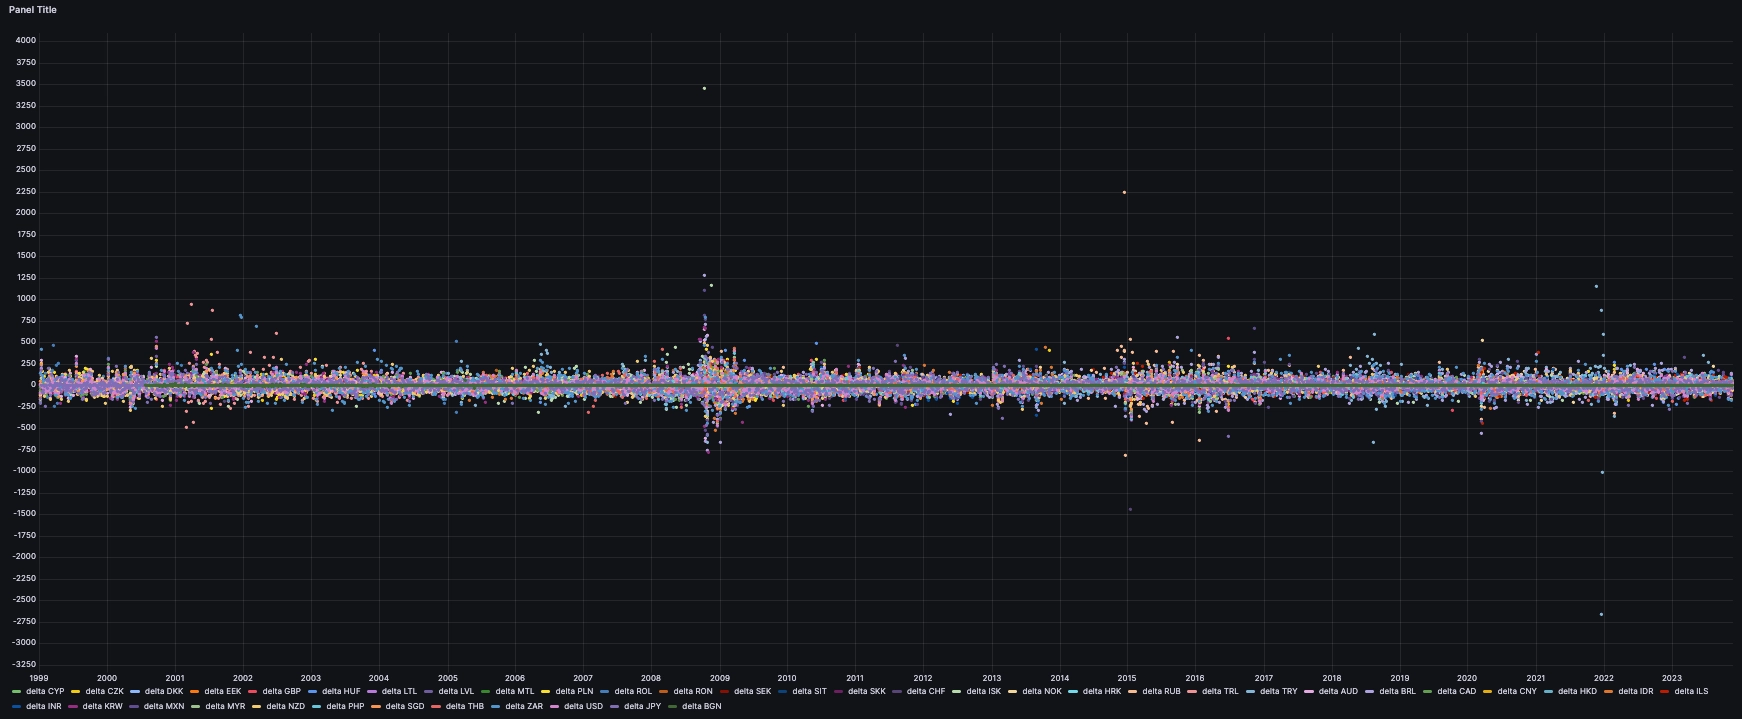
SELECTtimestamp time,currency,(last(price)/first(price)-1)*10000 deltaFROM fxWHERE $__timeFilter(timestamp)SAMPLE BY 2d
Just from this view, a few events jump out without the need to calculate any further derivatives:
- 2008 Financial Crisis
- 2015 Invasion of Crimea
- Covid in 2020
- Turkish inflation in 2022
- Swiss Franc peg removal in 2014
It's been a wild couple of decades!
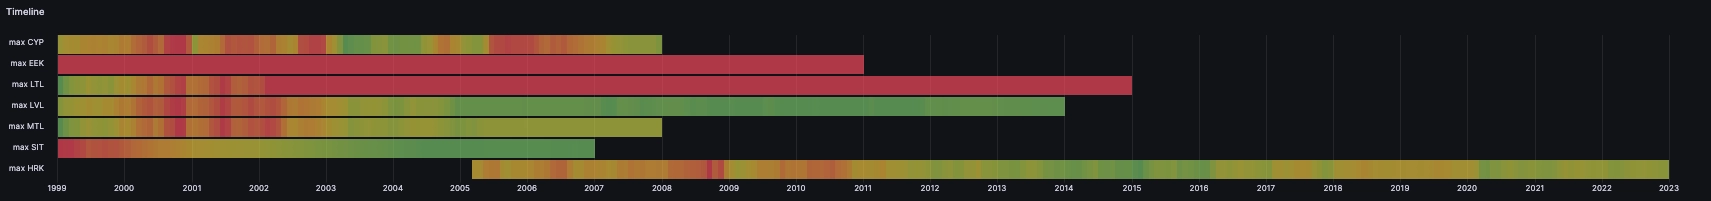
Timeline overview
Another way to look at it is through the context of a timeline.
We can use the State timeline chart type with the following query:
SELECT timestamp as time, currency, max(price)FROM fxWHERE $__timeFilter(timestamp)SAMPLE BY 1M
And as a result:
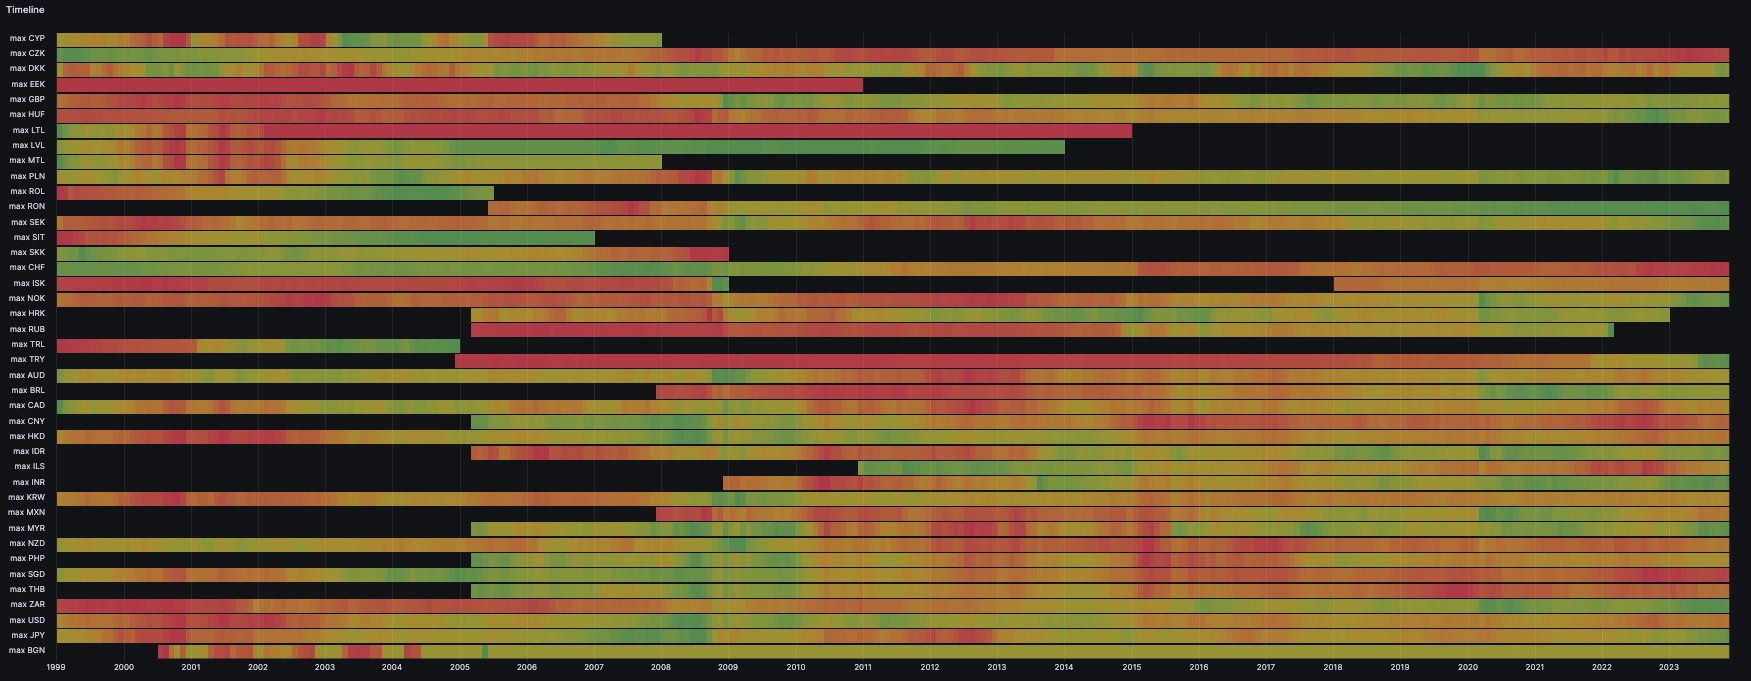
The timeline colors represent the strength of the EUR against the currency relative to the historical peak point. Green means the EUR was historically strong relative to the currency's range for that time interval and red means the EUR was weak relative to the peak point.
The timeline highlights a few interesting things:
- End of the old Turkish Lira (LTL) replaced by the new one (TRY)
- End of various currencies as more countries enter the Eurozone, like Lithuania, Poland, Latvia, Cyprus, and so on
- De-referencing of the Ruble following the invasion of Ukraine
Performance overview
We can look at the data from a relative performance point of view. For example, we can ask: How did all the currencies move against the EUR in relative terms since a point in time?
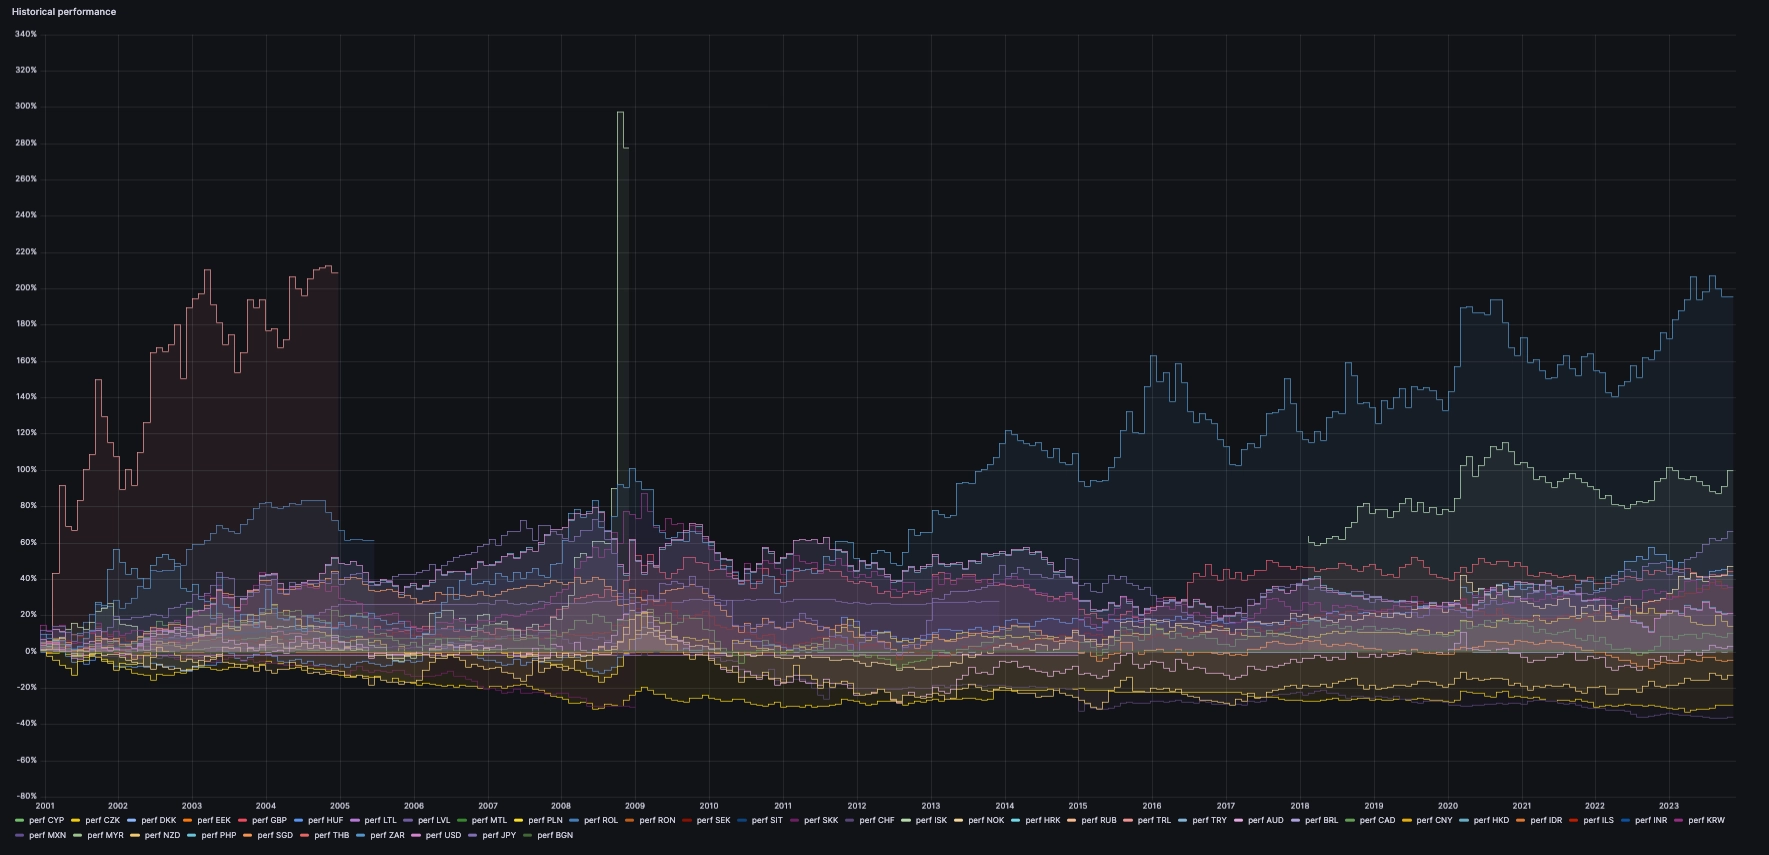
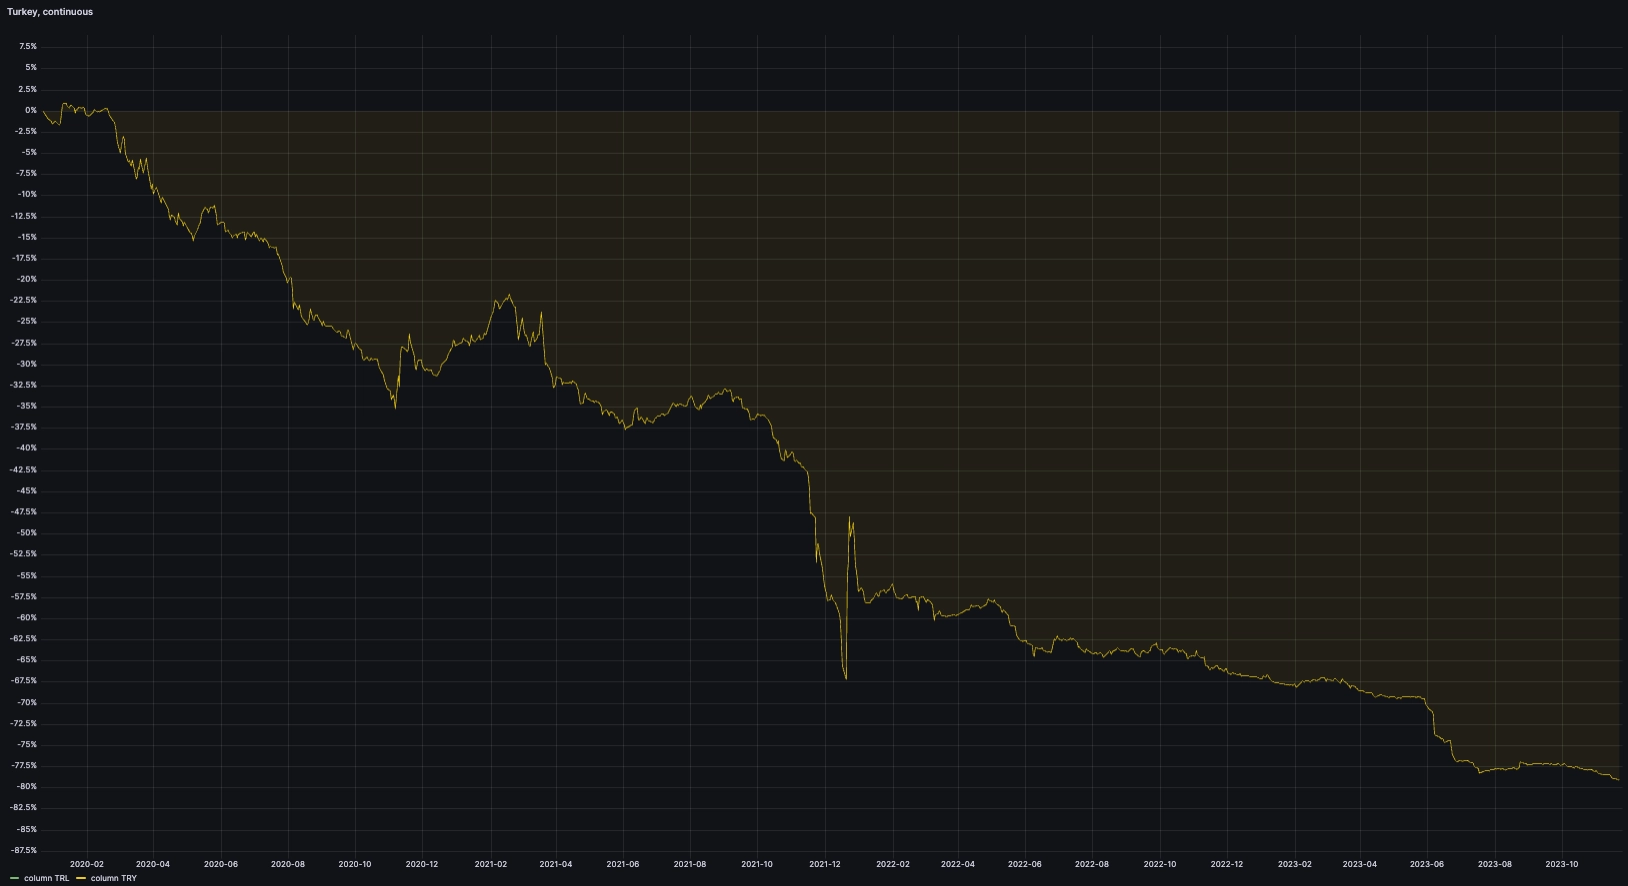
We can zoom in on any time frame (since 2020) that highlights the Turkish inflation and rapid currency devaluation:
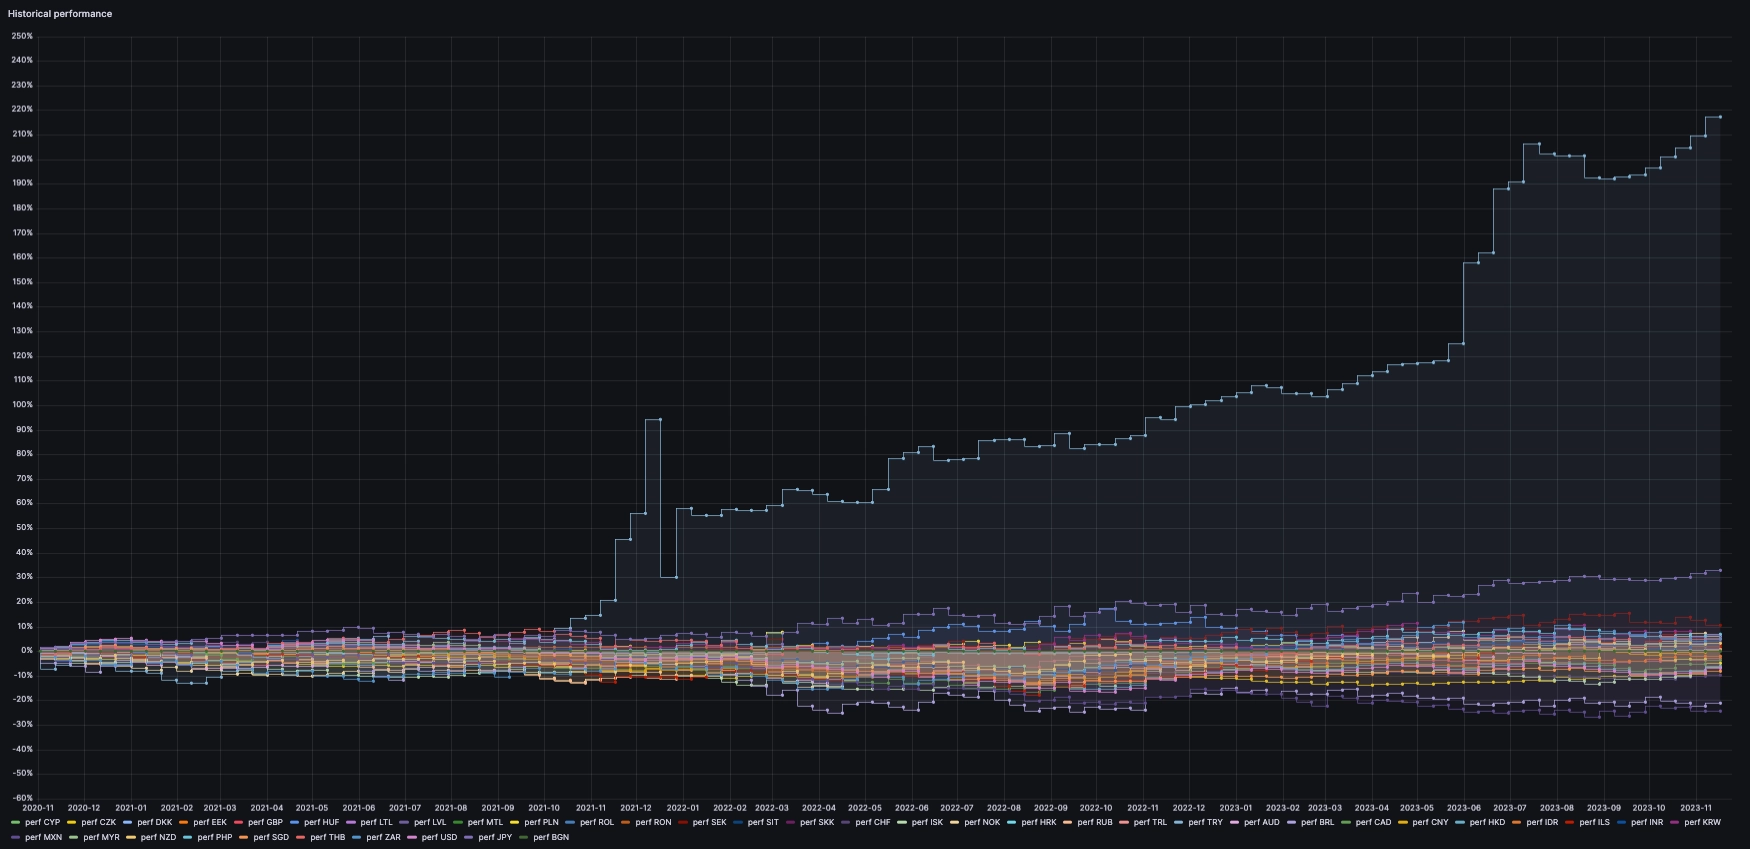
Looking at significant events is very neat.
Let's see where we're going.
Unpacking noteable events
Countries joining the Eurozone, leaving ECB data
The data's universe changes as the Eurozone expands.
We can see contributions for various countries disappearing over time as they adopt the EUR in lieu of their currency. In 2006, the Slovenial Tolar, in 20007, the Cypriot pound and Maltese lira, and so on. The latest to date was Croatia with the Croatian kuna yielding to the EUR in early 2023.
Turkish inflation
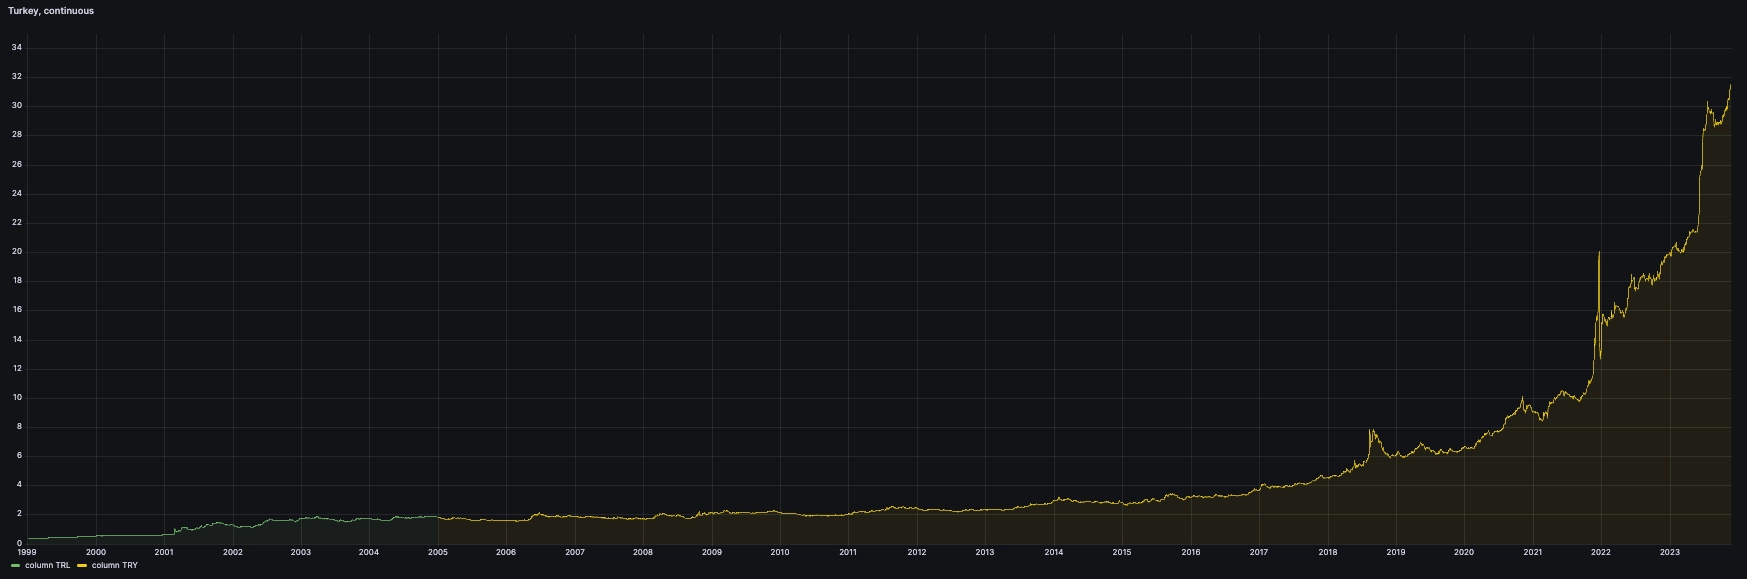
More recently and much more dramatic, Turkey has been battling a currency situation for decades now. We can see first that they replaced the 'old' lira (TRL) with the 'new' in 2005 prompting the ECB to discontinue the former in their file and add the latter:
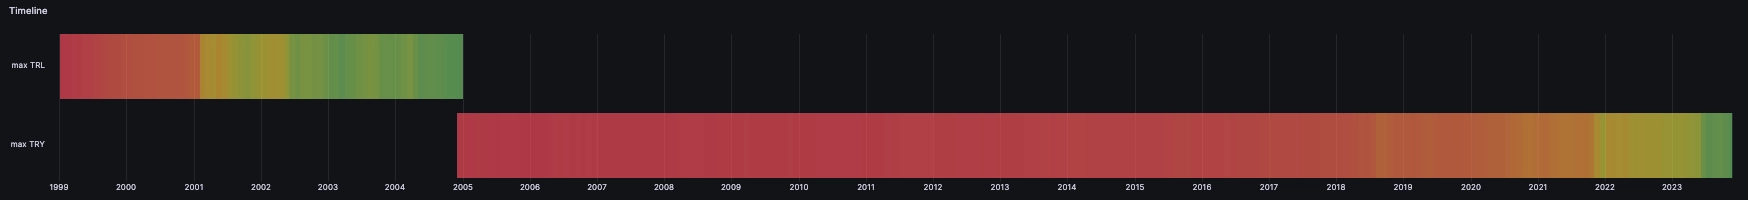
Interestingly, the above chart not only shows the introduction of the new currency, it also shows the reason for its introduction: a continuous loss of value of the TRL against the EUR.
This is reflected by a color gradient from red - EUR is at its weakest historical point against TRL - to green, EUR is at its strongest historical point relative to TRL.
Rather worryingly for Turkey, the recent unprecedented pace of inflation and devaluation is clearly visible on the new lira which exhibits the same gradient change over time.
Since Turkey had 2 currencies over time, this results in 2 charts on completely different scales:
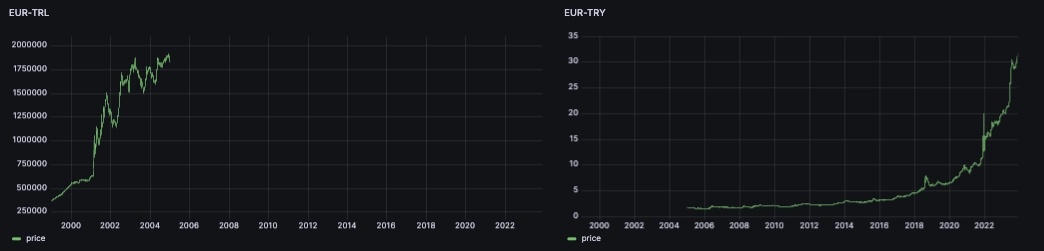
However, we can plot both together to see a full timeline using a UNION query,
and the official conversion factor from 1,000,000 between the old and new
lira:
SELECT timestamp as time, currency, price/1000000FROM fxWHERE $__timeFilter(timestamp) and currency = 'TRL'UNIONSELECT timestamp as time, currency, priceFROM fxWHERE $__timeFilter(timestamp) and currency = 'TRY'
Another way to look at it is to take the inverse of the Turkish Lira against the EUR compared to the starting value in the dataset:
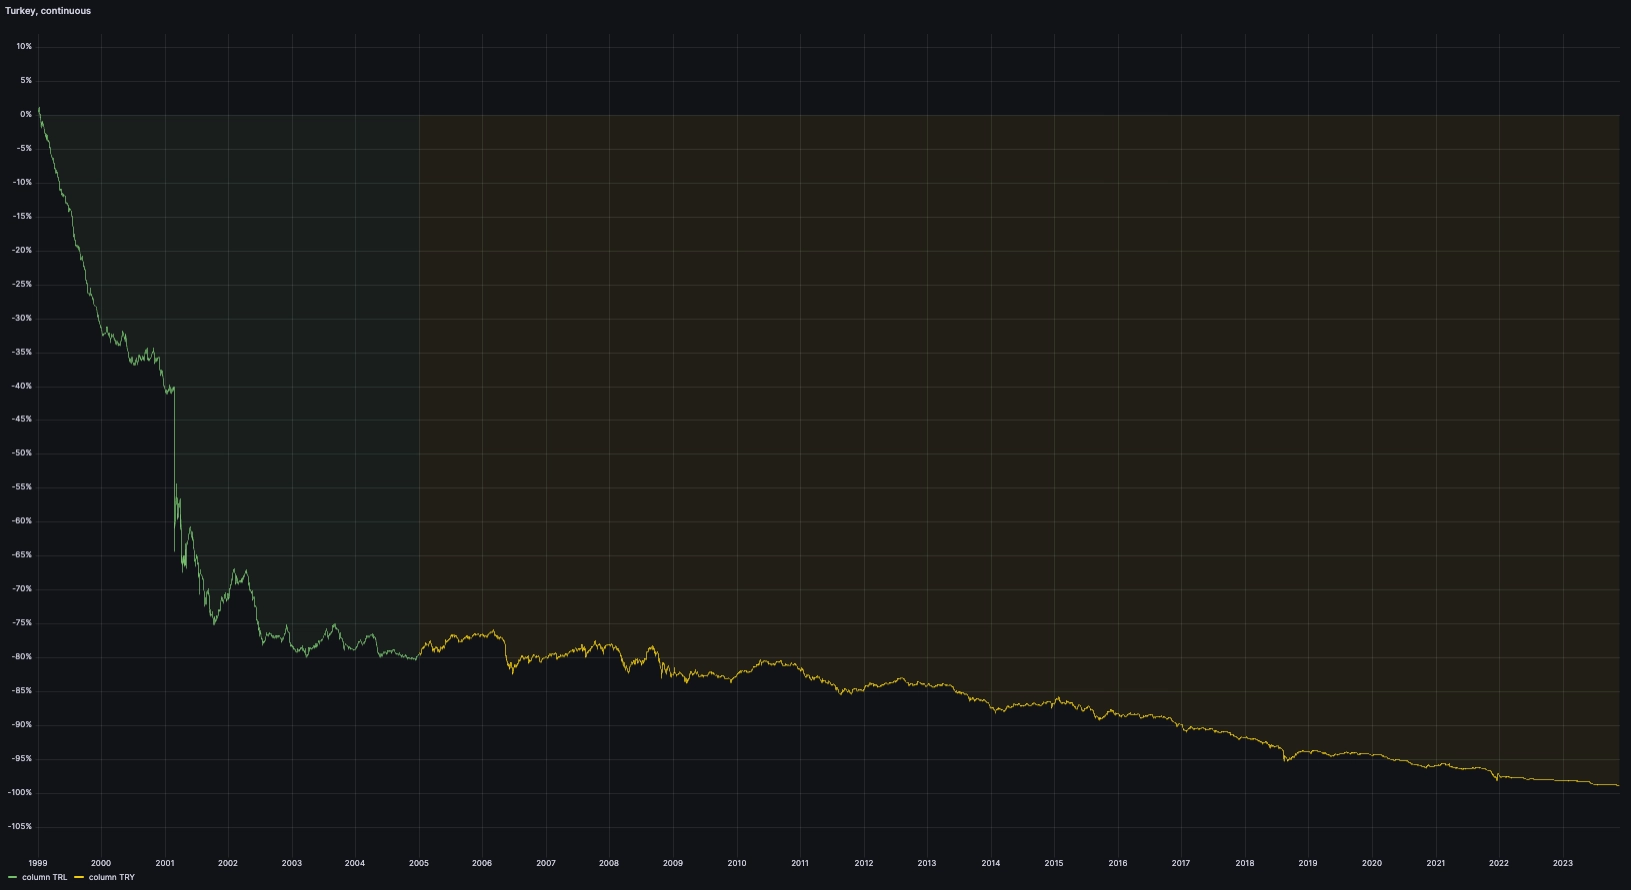
Since 1999, the lira, adjusted for the change from the new to the old lira, lost 99% of its value. More worryingly, the pace has accelerated since 2020 with the lira losing 80% of its value relatively quickly.
This is of course a reflection of the Turkish runaway rate of inflation. It is particularly evident over the last few years. The reasons behind Turkey's economic situation are diverse and complex, but this video from Patrick Boyle is a pretty comprehensive overview of the current situation in its historical context.
Switzerland unpegs its currency by surprise!
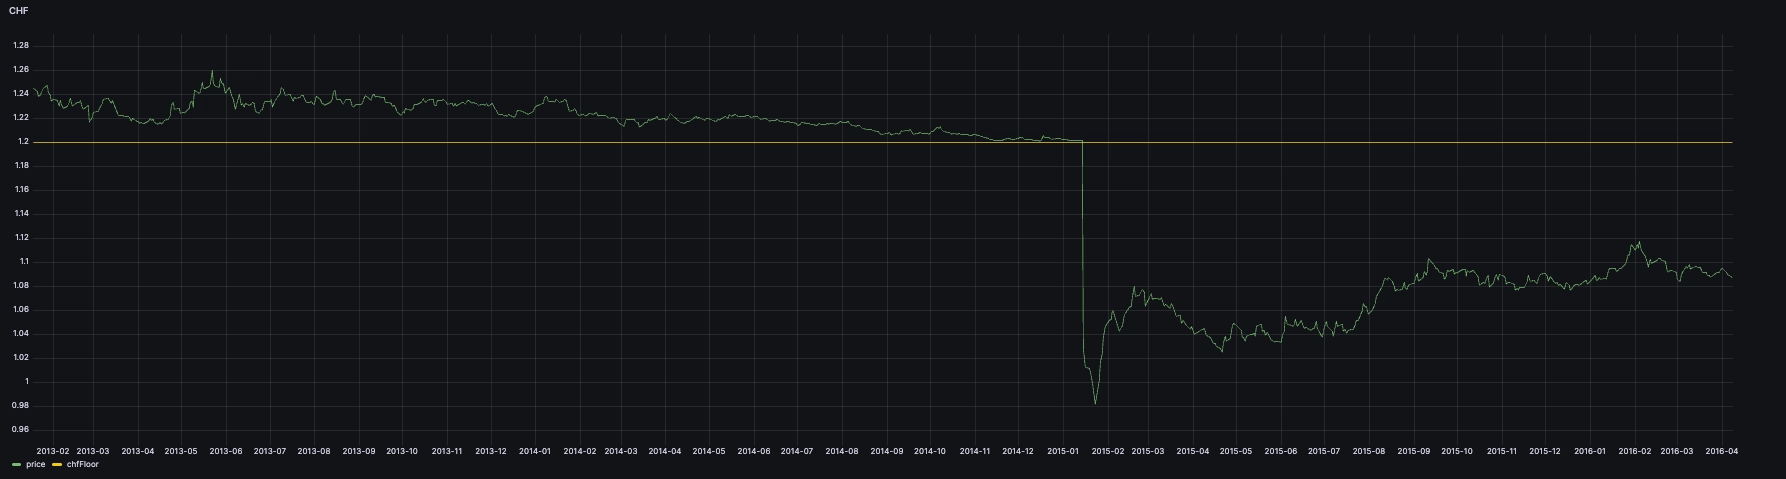
In September 2011, the SNB (Swiss National Bank), established a peg from the Swiss Franc to the euro at a rate of 1.20 EUR/CHF. They did so to make it easier for Switzerland to do business internationally.
In the previous two years, the Swiss Franc had increased about 45% against the EUR. Having an exchange rate that is (a) stable and (b) less expensive for foreign countries makes it easier to conduct international trade. It worked mainly with the Swiss National Bank (SNB) intervening in the currency markets.
On the 15th of January 2015, Switzerland removed the currency floor against the EUR at 1.20 in a move that surprised markets:
SELECT timestamp time, priceFROM fxWHERE $__timeFilter(timestamp) and currency = 'CHF'
This move was quite a day in the markets. It wiped out several players as this was a complete surprise. And to make matters worse, it was inconsistent with the messaging from the SNB that claimed to be committed to the Euro peg.
Until then, the currency could 'technically' only move in one direction: it coul dbe lower than 1.20 EUR per CHF and the pair had very low volatility. After the currency was left to float, we entered a new volatility regime where the currency could go either way, and fluctuated more:
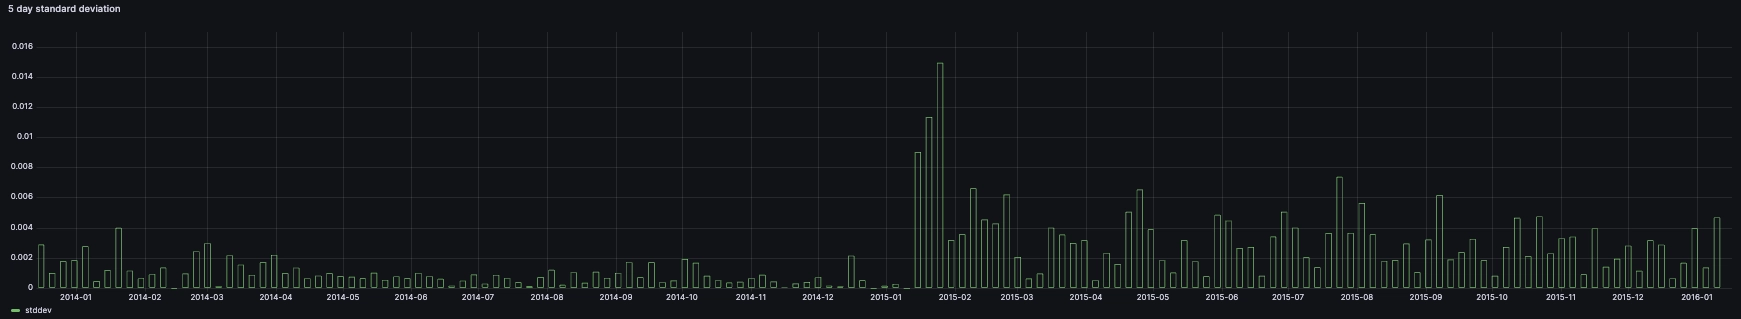
SELECT timestamp time, stddev(price)FROM fxWHERE $__timeFilter(timestamp) and currency = 'CHF'SAMPLE BY 5d
The icelandic situation within the 'Great recession'
In 2008, Iceland experienced a collapse of its three major banks which had to be taken over by the government. The country's currency Krona (ISK) faced a sharp depreciation which resulted in strong inflation, and the country had to receive a bailout package from the Interional Monetary Foundation (IMF). Iceland also introduced capital controls from late 2008 to 2017 to stabilise the currency and the economy.
Like Switzerland (but for opposite reasons), Iceland attempted to peg the Krona at 131 ISK per EUR in 2008. However, unlike the Swiss peg, the Icelandic peg did not hold for long and was abandoned the next day with the Krona dropping to 340 ISK per EUR. After that, the currency was suspended, and following this, trading was so sparse that the ECB stopped publishing reference rates until 2017:
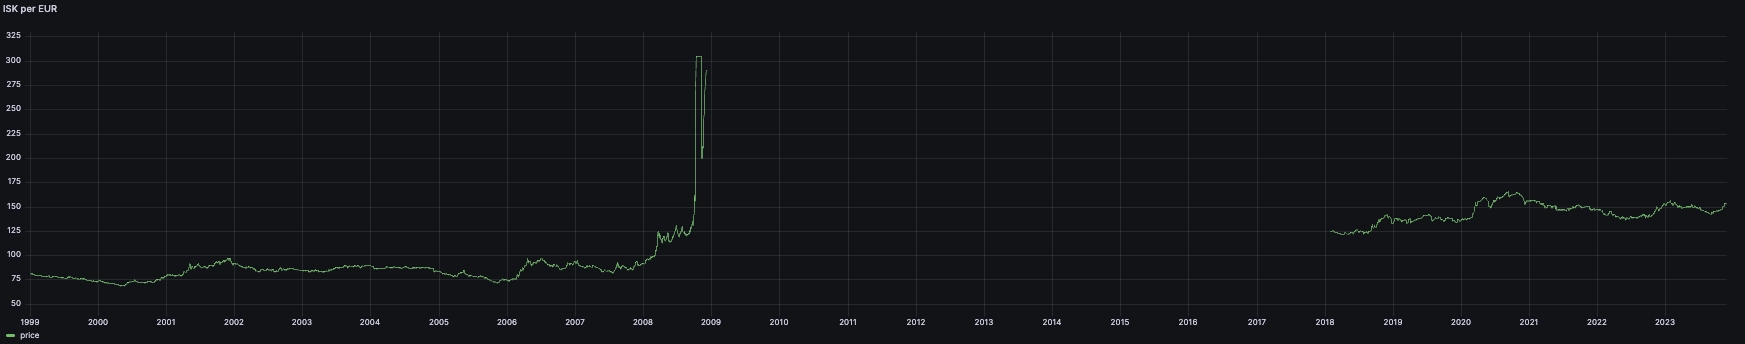
SELECT timestamp time, priceFROM fxWHERE $__timeFilter(timestamp) and currency = 'ISK'
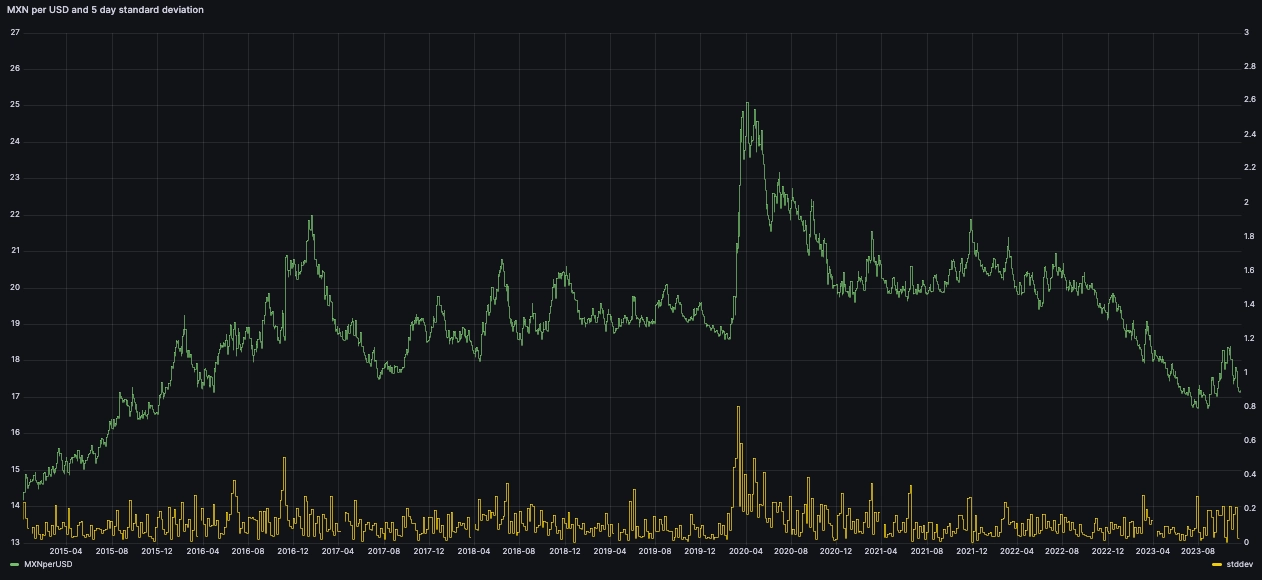
Trump gets elected
In November 2016, Donald Trump was elected president of the United States.
During his campaign, he had been speaking of nationalistic and protectionist measures, particularly against Mexico. On the day he was elected, the Mexican peso (MXN) dropped 6% against the dollar from one ECB print to the next, and double that intraday.
We can derive the implicit USD/MXN rate by doing a cross between both currencies against the EUR from the ECB data file:
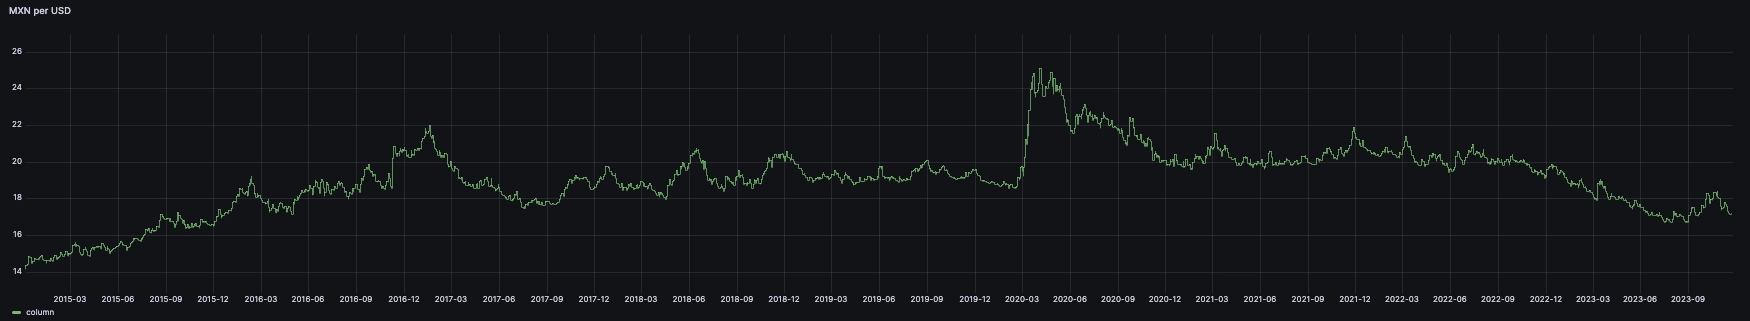
WITHMXN AS (SELECT timestamp time, price FROM fx WHERE $__timeFilter(timestamp) and currency = 'MXN'),USD AS (SELECT timestamp time, price FROM fx WHERE $__timeFilter(timestamp) and currency = 'USD')SELECT MXN.time, MXN.price/USD.price FROM MXN ASOF JOIN USD
Wile it's hard to see the jump in the chart above, we can make it stand out by looking at the day-to-day jumps:
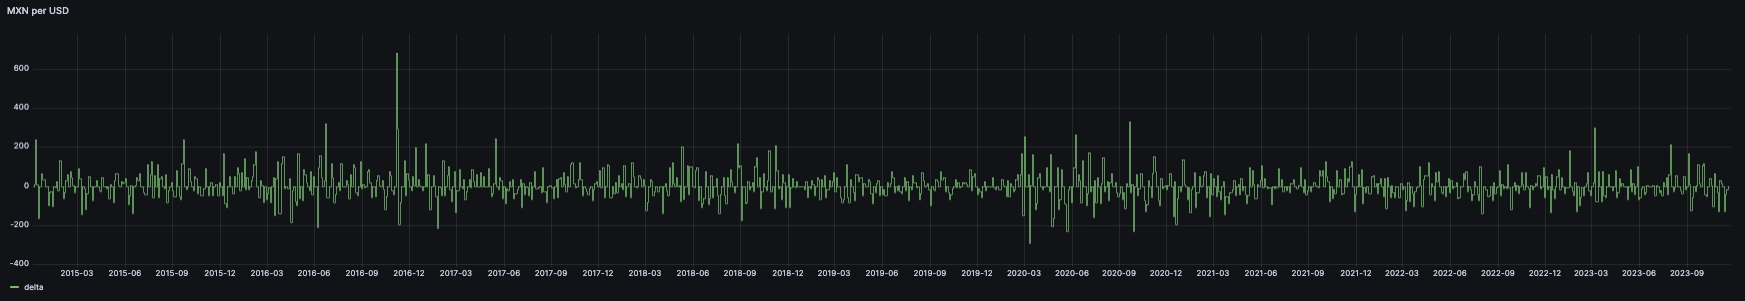
It's a rather impressive one-day move considering that its magnitude hides away the pandemic which took place a few years later on this particular chart.
However, if we plot differently, we can see the effect of the pandemic was 'overall' much larger, but happened over several days:
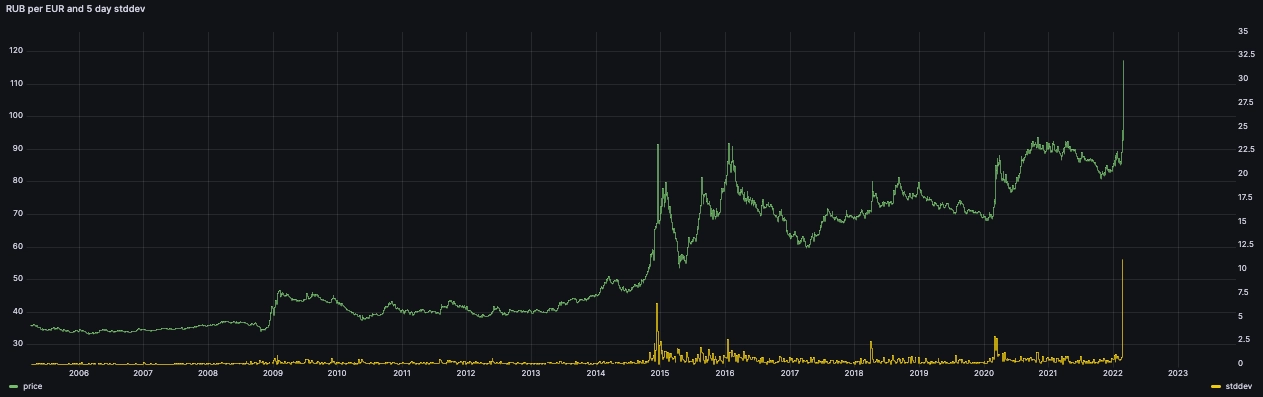
Ruble crashes following Ukraine invasion and gets removed by the ECB
The Russian ruble crashed twice. In 2015, following the invasion of Crimea, and in 2022 following the invasion of Ukraine. After the second invasion, and following a barrage of sanctions, the RUB was unlisted by the ECB.
Owing to current trading activity in the EUR/RUB market, the European Central Bank (ECB) is not in a position to set a reference rate that is representative of prevailing market conditions. The ECB has therefore decided to suspend its publication of a Euro reference rate for the Russian rouble until further notice. The ECB last published a EUR/RUB reference rate on 1 March 2022.
Summary
Looking at historical data is fascinating. Hopefully, we can learn from these events to build calmer, more stable global financial evironment.
All charts within this article were produced with QuestDB, using the official QuestDB Grafana plugin. There are certainly many more interesting events which can transpire through this dataset, but these were a few of the highlights from playing with it in Grafana with QuestDB.
We'd love to see what sort of interesting events you can identify!
Interested in more Grafana tutorials?
Check these out:
- Fluid real-time dashboards with QuestDB and Grafana
- Build your own resource monitor
- Tracking sea faring ships with AIS data and Grafana
- Visualizing real-time NYC cab data and geodata
- Discovering stories in French real estate data
- Increase Grafana refresh rate frequency
- Or checkout our Grafana blog tag