Grafana is great at creating custom dashboard with vibrant custom charts. One lesser known feature is the ability to create dynamic dashboards which adjust to your dataset on-the-fly. This is particularly useful in financial use cases where you ingest data on a multitude of distinct symbols and add new symbols over time. QuestDB - known for its peak ingestion performance and SQL analytics - is a strong match for Grafana for market data use-cases.
Our tutorial will use the ECB historical FX rates dataset as an example. This dataset is well representative of financial market data. Note that it is a simplified daily dataset that only covers a few currencies exclusively against the EUR.
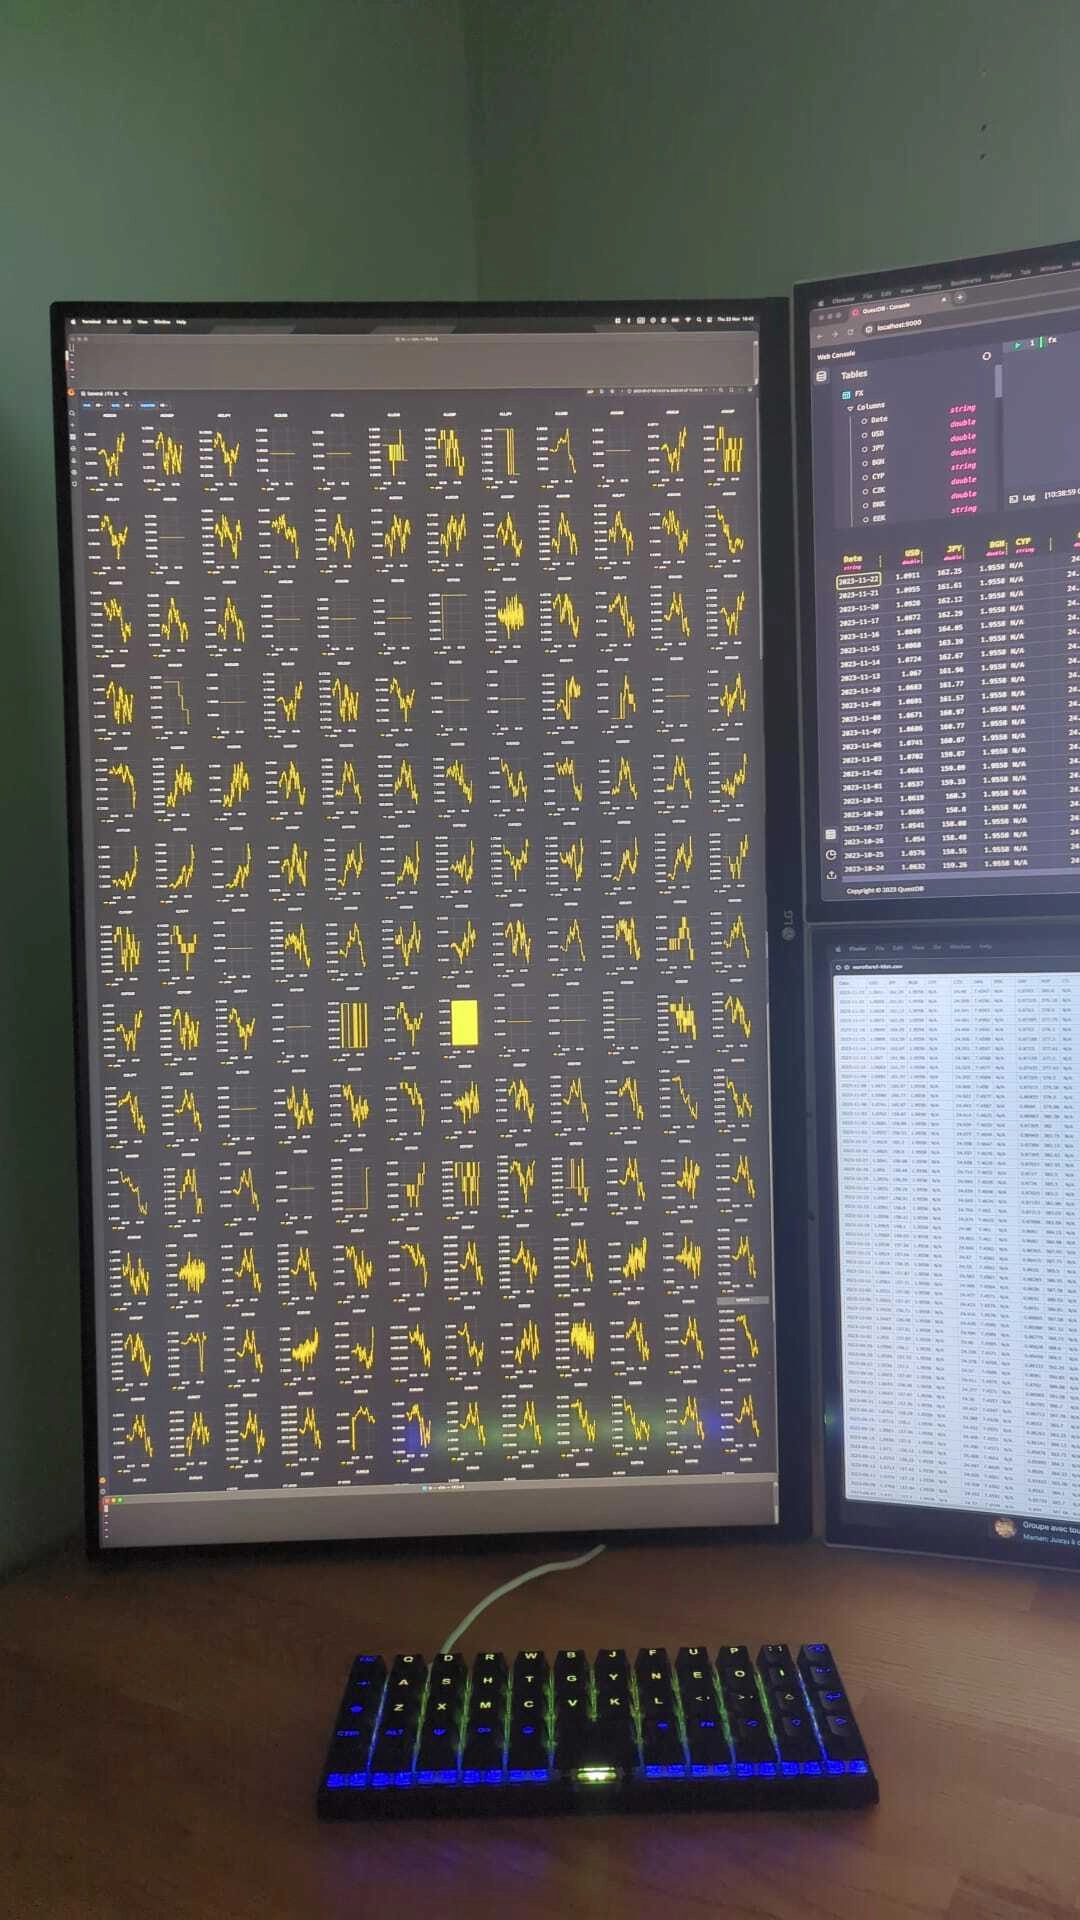
In real cases, the list of distinct symbols could be much larger and the frequency much higher. The bottom line is that you will be able to do something like this in no time, regardless of the size of the list and the underlying sampling frequency:
Setup QuestDB and Grafana
Before we begin, if you would like to follow along, check out our tutorial on setting up QuestDB and connecting to Grafana, or visit the Grafana docs.
Now let's get started!
The problem with non dynamic charts
Let's say you start a new dashboard to view FX rates in realtime. The simple approach is to create individual charts for each currency.
For example something like this:
SELECT timestamp as time, price
FROM ecbFxRates
WHERE $__timeFilter(timestamp) AND currency = 'USD'
The last part AND currency = 'USD' means that if you want to add another
currency, you need to manually create a new chart, copy paste the query and
adjust the hardcoded currency. This quickly becomes tedious and will not scale
well, particularly if you have a future plan to change the original query. If
you do, you'll need to adjust all of the individual charts.
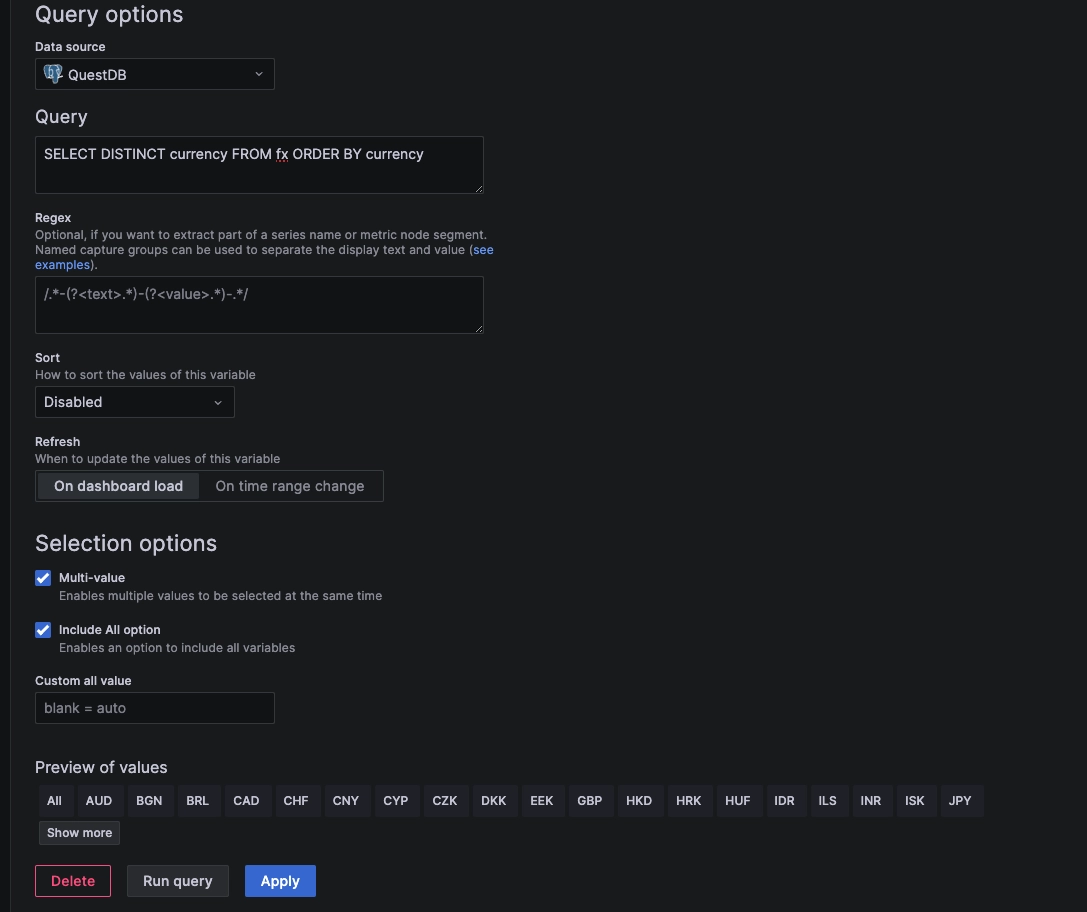
Repeating charts with custom variables
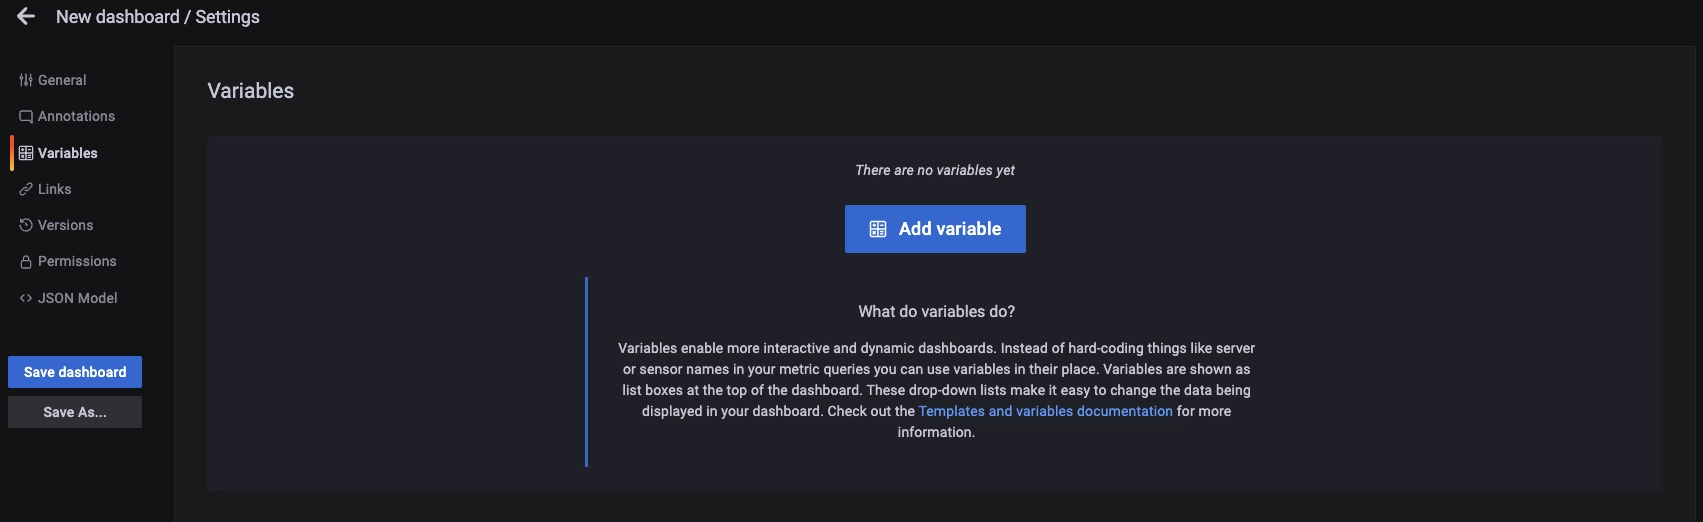
A strong first step is to create a custom variable with a custom list. You can
do so using the variables section of your Dashboard settings in Grafana:
This allows you to create custom and query based variables:
customallows you to create a hard coded list. You can thenSELECTfilter your data and repeat charts for a specific subset of data.queryallows you to create a dynamic list which will consist of the results of a query to your underlying QuestDB database.
We can start by defining a custom list as follows:
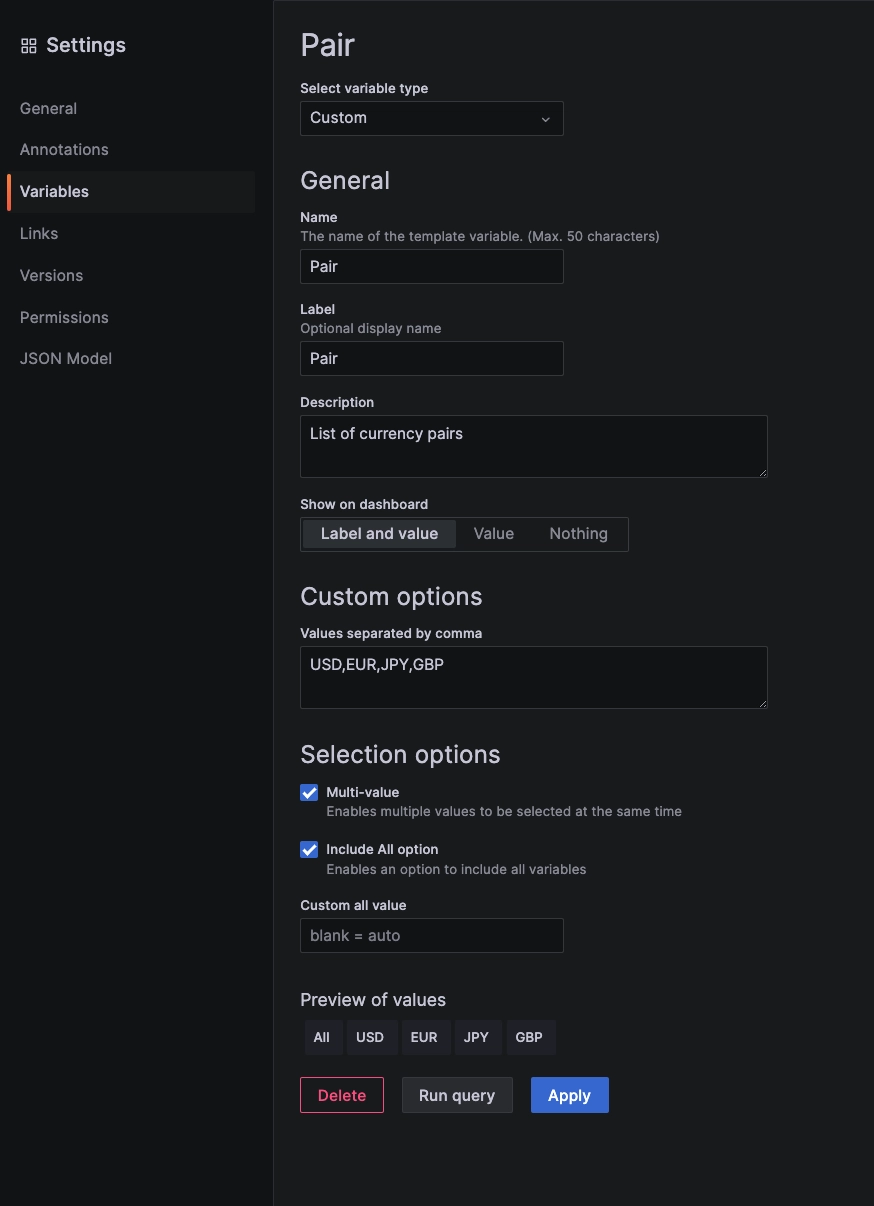
There are two notable options..
Multi-valueallows you to select multiple values at a time. This is useful when the values are not mutually exclusive or when you want to display them side by side.Include all optionadds anALLoption to your list of possible values which means you do not have to select them all individually.
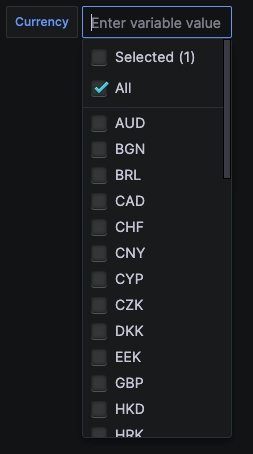
Once you are done configuring, a list preview appears at the bottom. Click
Update to save the variable. It will now be available as a dropdown in your
dashboard variables at the top of the cart:
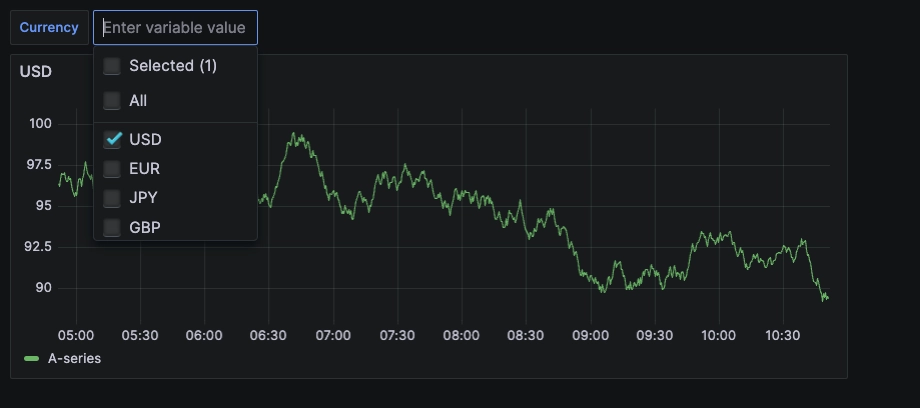
The dashboard does not react to this variable yet. For it to do so, we need to adjust our settings.
Using our newly created variable
We make three adjustments…
- Adjust the chart so that it repeats based on individual selections of the variable. For example, one chart for EUR, one chart for USD and so on
- Adjust the query so that the variable settings are reflected in the data
- Adjust the chart settings so that the titles reflect appropriately
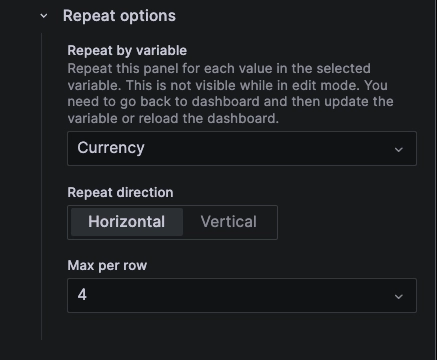
Grafana chart repeat options
To adjust the chart, edit the chart and alter the Repeat options.
The parameters are:
Repeat by variable: Choose the variable you want to use. In this case, we choose our newly createdCurrencyvariableRepeat direction: Whenhorizontal, then the chart panel will be duplicated for each individual variable to the right up to themax per rowvalue. The latter will define how many charts to display per row in your window before moving to the next row. Theverticaloption is useful when you want to display various charts side-by-side. The charts will repeat vertically and you can set another adjacent column with another chart repeating vertically to see, for example, another data metric or a derived metric.
Adjusting the Grafana query to QuestDB
Grafana uses a variable inside of a query to make it dynamic. This is done by
replacing the hardcoded values by the variable name preceded by a $ sign. For
example, your query could be changed from this:
SELECT timestamp as time, price
FROM ecbFxRates
WHERE $__timeFilter(timestamp) AND currency = 'USD'
To this:
SELECT timestamp as time, price
FROM ecbFxRates
WHERE $__timeFilter(timestamp) AND currency = $Currency
In the background, Grafana will replicate and convert the query and dispatch it
to the database. So, for example, if you have repeat options to display a chart
for USD and another for JPY, Grafana will issue two queries. It will replace
=$Currency with ='USD' in the first and with ='JPY' in the second.
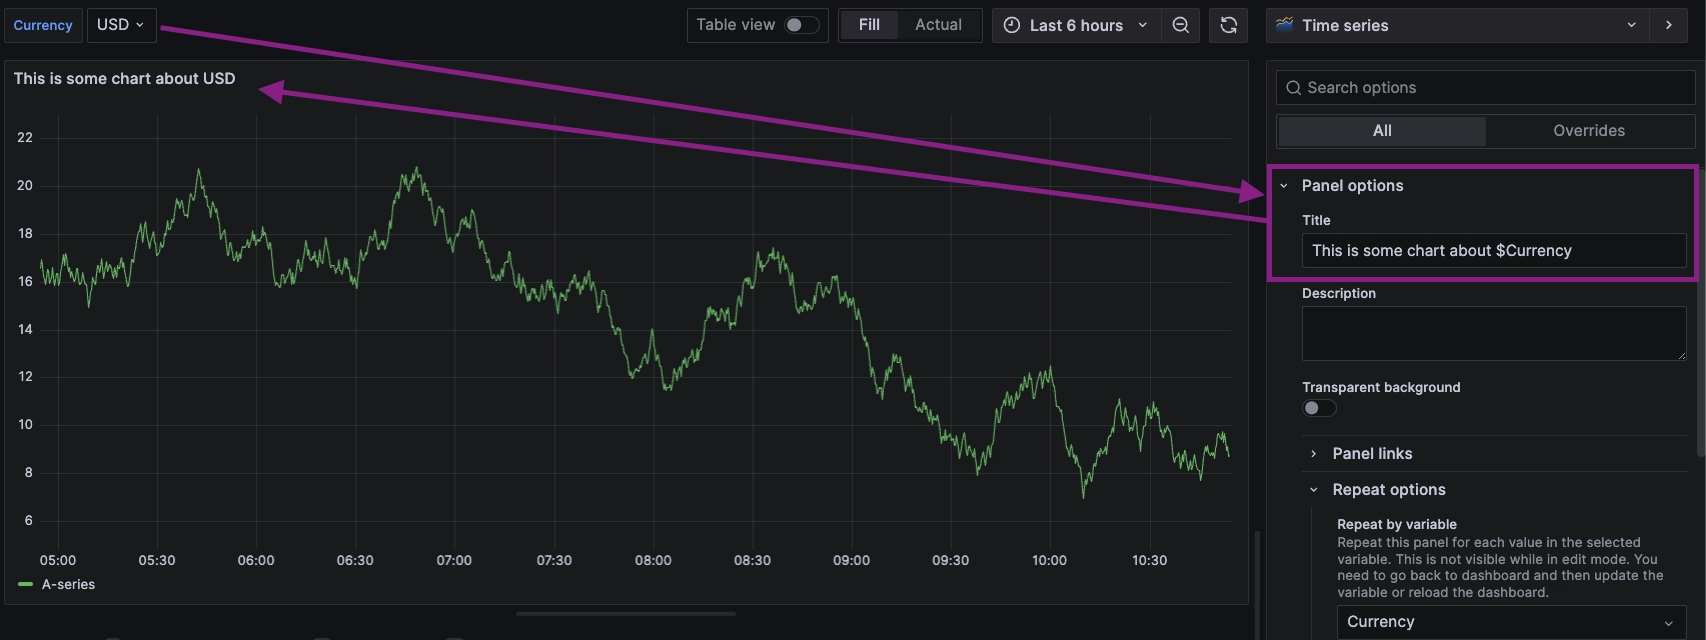
Adjusting the Grafana chart settings
One nice thing about these Grafana variables is that you can use them in your chart settings as well as in your queries. So for example, you can use them in your chart title, description and so on:
Using queries to generate dynamic lists
In the above example, we still hardcoded the list of possible currencies. This
is not strictly best practice. You'd still need to edit the list whenever you
want to add a new currency. To make this dynamic, we can replace the custom
parameter in the variable definition with query.
Doing so allows us to use the results of a QuestDB query to generate a list in real time. The main benefit is that if a new symbol value is added, then the dashboard will adjust automatically with no manual intervention whatsoever.
Deviation - first, let's import the data
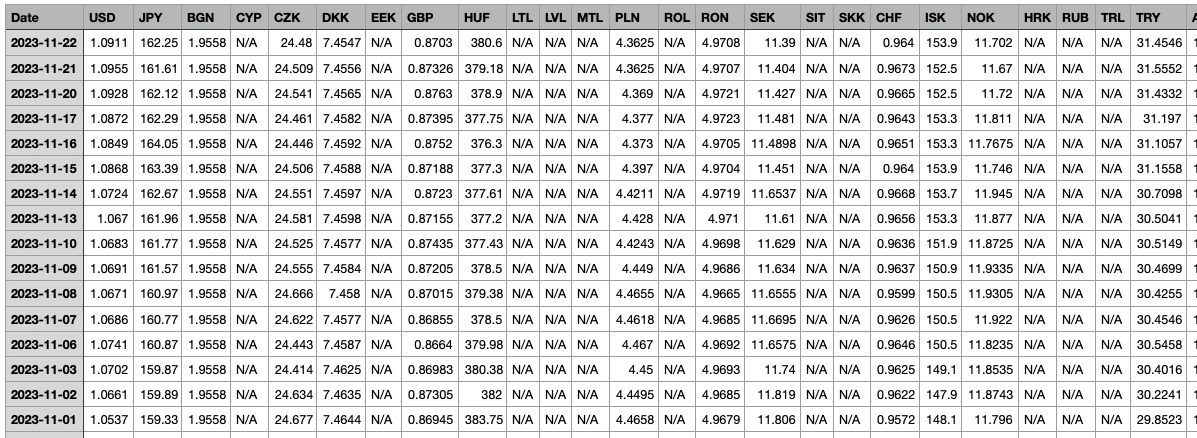
In this particular instance, we import the FX rates from the ECB into a QuestDB instance. Since the original file displays the different currencies as distinct columns, we can also change the format to something more usable.
The original ECB file:
And the updated DDL statement to create the new schema:
CREATE TABLE fx(
    timestamp TIMESTAMP,
    currency SYMBOL,
    price DOUBLE
) TIMESTAMP(timestamp) PARTITION BY MONTH;
After, we import the ECB CSV file into the QuestDB web console and run a script to copy each column into the database. This uses the to_timestamp function to convert string to QuestDB timestamps:
INSERT INTO fx(timestamp, currency, price)
SELECT to_timestamp(date, 'yyyy-MM-dd'), 'USD', CAST(USD AS DOUBLE)
FROM eurofxref-hist;

INSERT INTO fx(timestamp, currency, price)
SELECT to_timestamp(date, 'yyyy-MM-dd'), 'JPY', CAST(JPY AS DOUBLE)
FROM eurofxref-hist;

INSERT INTO fx(timestamp, currency, price)
SELECT to_timestamp(date, 'yyyy-MM-dd'), 'BGN', CAST(BGN AS DOUBLE)
FROM eurofxref-hist;
...
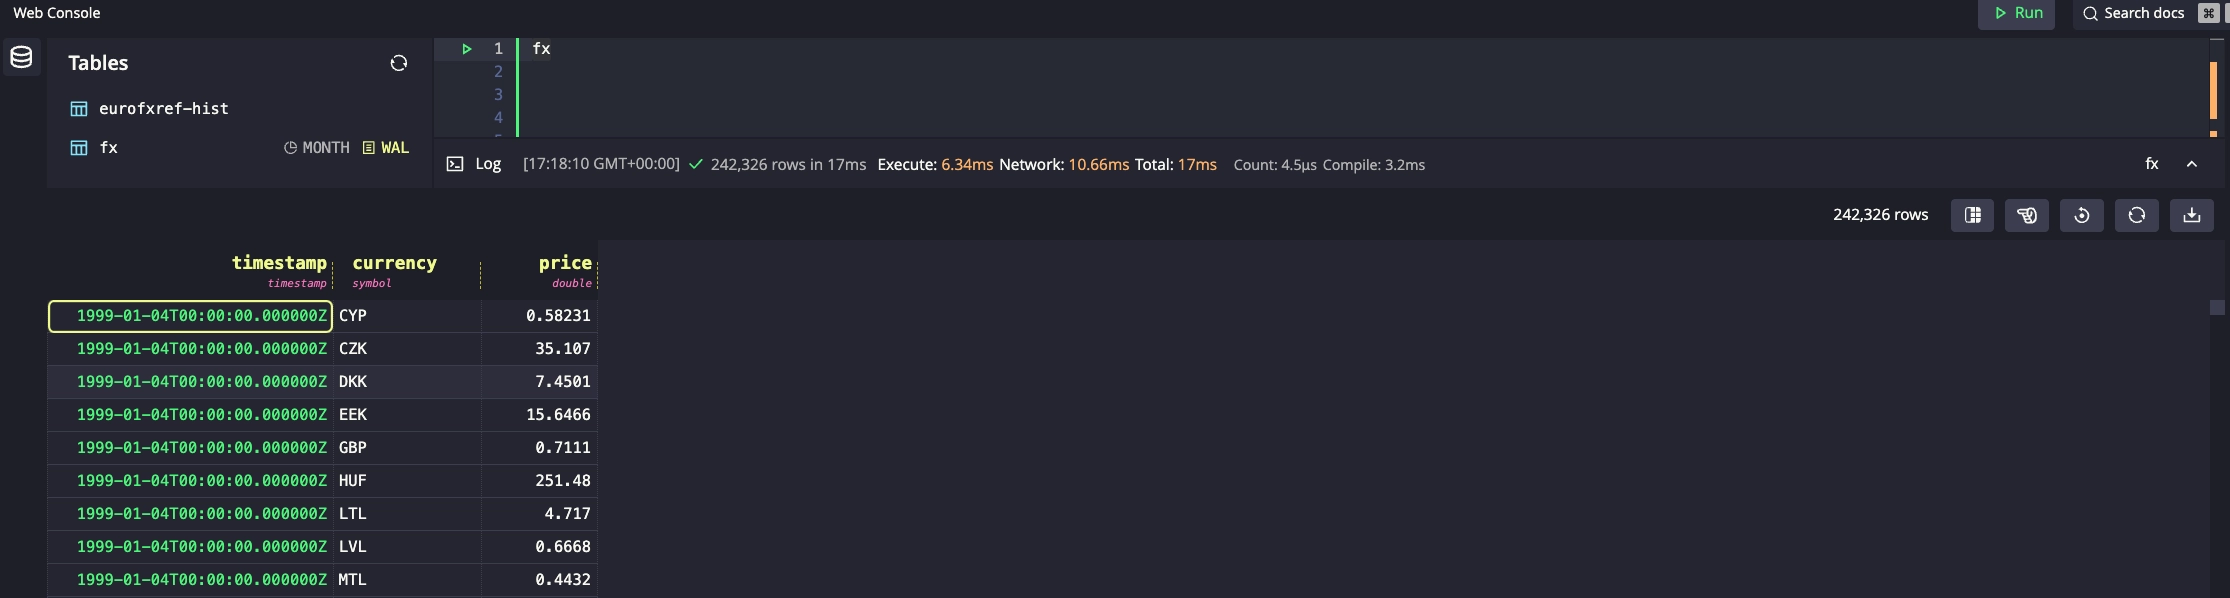
The resulting dataset looks as follows:
Finally, let's use queries to feed Grafana variables
Time for the cool part. We can get a list of unique symbols with a DISTINCT query. We use ORDER BY clause to ensure the symbols are in alphabetical order which makes it easier later to pick them from a list:
SELECT DISTINCT currency FROM fx ORDER BY currency;
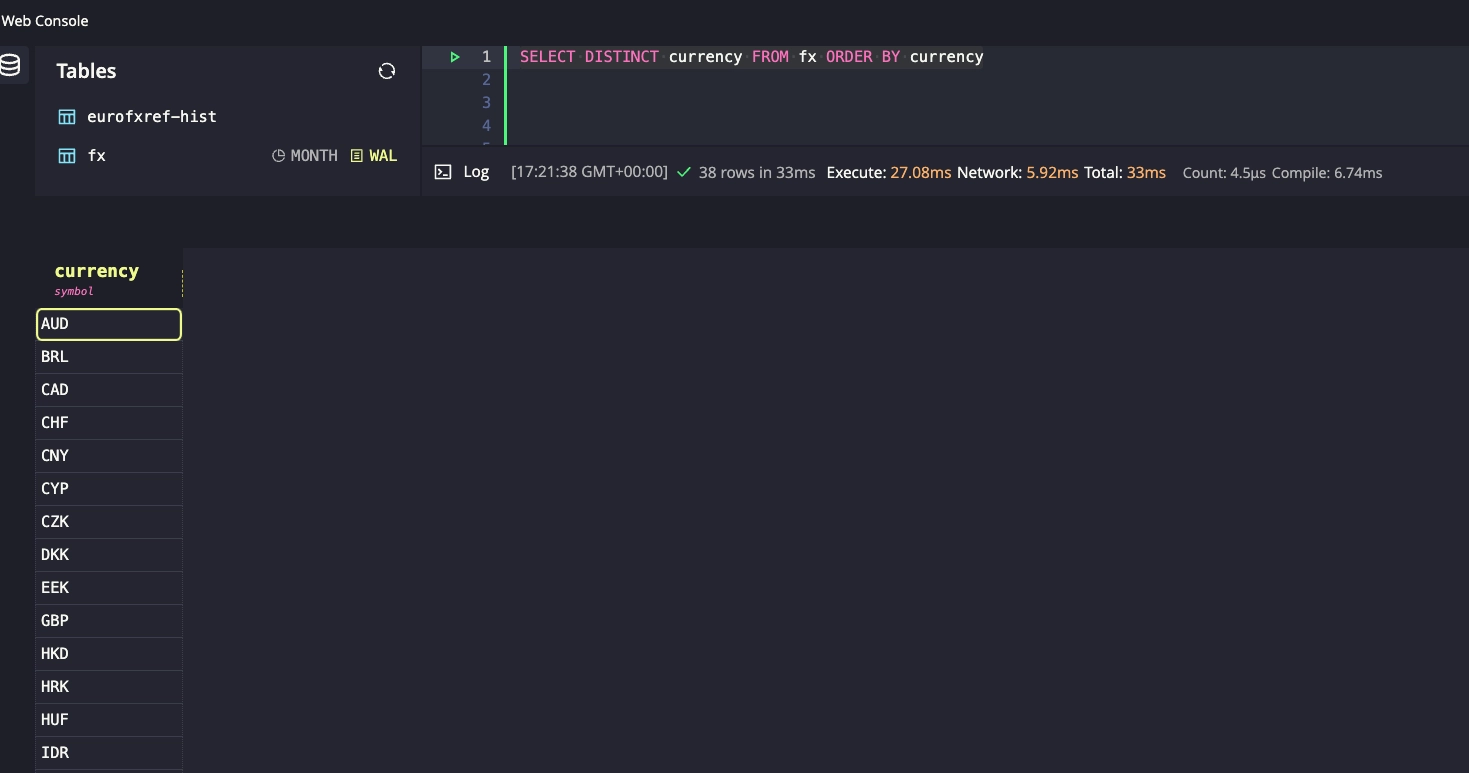
Now we can modify the original Grafana variable to be a query and use the
above syntax as the definition:
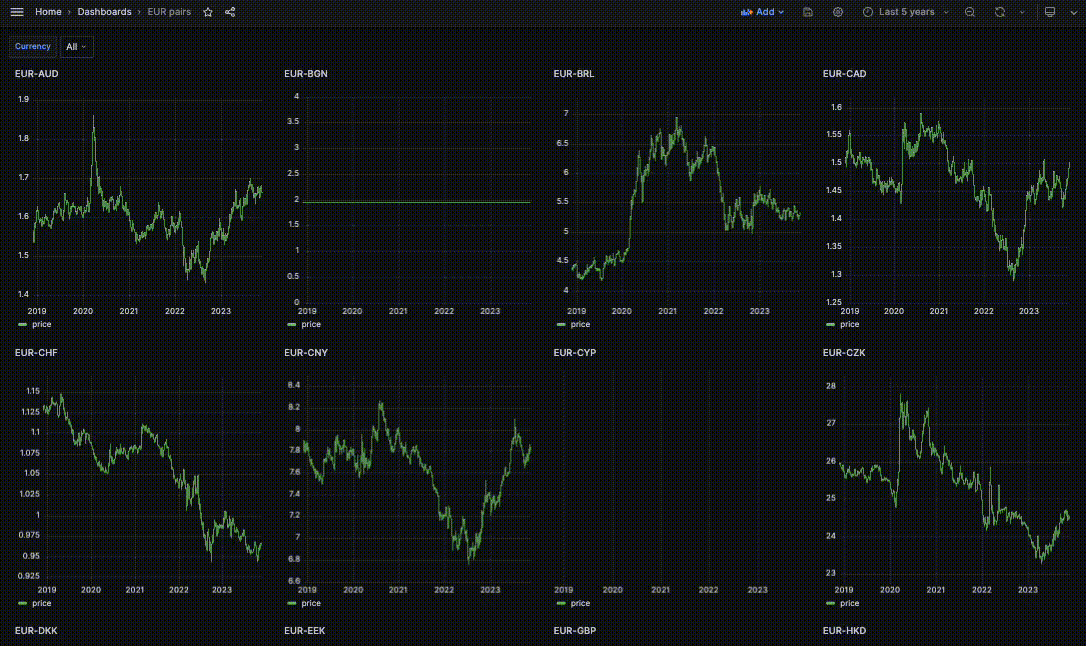
Our list of currencies is now dynamic!
And our array of charts is dynamically linked to this list and it automatically adjusts with our selections!
Summary
In this tutorial, we demonstrated how to manage large lists of symbols using Grafana variables and QuestDB. We used the ECB historical FX rates dataset to create dynamic dashboards that adjust to your dataset in real-time, a feature particularly useful in financial use cases where data is ingested on a multitude of distinct symbols.
Onwards, we used Grafana's custom variables to create repeating charts, adjust queries and chart settings. We also showed how to use queries to generate dynamic lists, making our dashboard adjust automatically with no manual intervention when a new symbol value is added. The result is a more efficient and scalable way to monitor and analyze market data.
Checkout our real time (crypto dashboard)[/dashboards/crypto] for further inspiration.
Interested in more Grafana tutorials?
Check these out:
- Working with Grafana Map Markers
- Fluid real-time dashboards with QuestDB and Grafana
- Build your own resource monitor
- Tracking sea faring ships with AIS data and Grafana
- Visualizing real-time NYC cab data and geodata
- Increase Grafana refresh rate frequency
- Or checkout our Grafana blog tag