Investigating Linux Phantom Disk Reads
Not so long ago, one of our users reached out for a case of weird hardware utilization. They were using our ILP (InfluxDB Line Protocol) client to insert rows into their QuestDB database, but along with disk writes, they also observed significant disk reads. That's definitely not expected from a write-only workload, so we had to get to the bottom of this problem. Today we share this story, full of rises and falls, as well as Linux kernel magic.
The problem: unexpected reads
As you may already know, QuestDB has an append-only columnar storage format for data persistence. In practice, this means that as the database writes a new row, it appends its column values to several column files.
This creates high disk write rates due to the sequential write pattern. When handling a write-only load, the database is not expected to read much from the disk. This is why the particular issue was surprising to us.
After a few attempts, we managed to reproduce the issue. The symptoms looked
like the following iostat output:
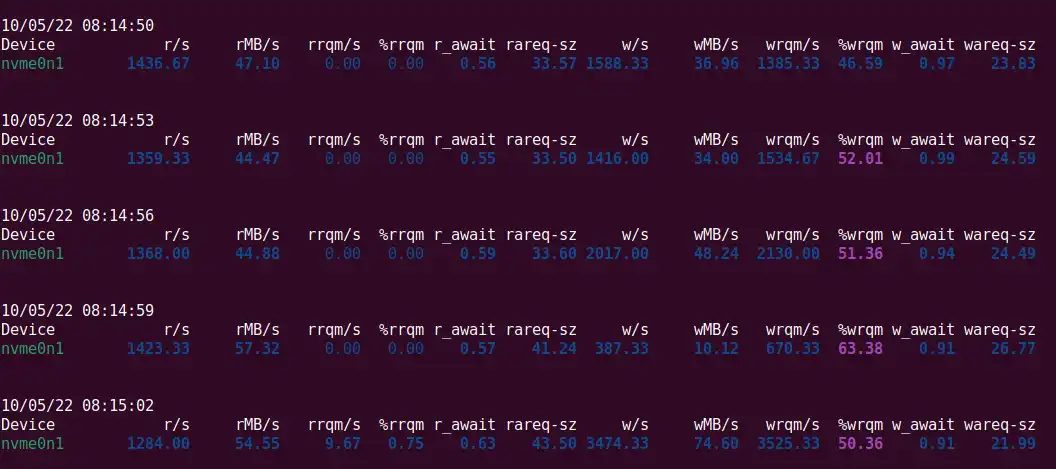
Here we have 10-70MB/s for disk writes while reads are as high as 40-50MB/s. Read utilization should be close to zero in ingest-only scenarios. The high read volume is, therefore, very much unexpected.
Using Linux utilities to investigate
The first thing we wanted to understand was the exact files that were read by
the database. Luckily, nothing is impossible in Linux. The blktrace utility
combined with blkparse can be used to collect all reads on the given disk:
sudo blktrace -d /dev/nvme0n1 -a read -o - | blkparse -i -
The above command prints all disk-read events happening on the system. The output looks something like the following:
259,0    7     4618     5.943408644 425548  Q  RA 536514808 + 8 [questdb-ilpwrit]
259,0    7     4619     5.943408967 425548  G  RA 536514808 + 8 [questdb-ilpwrit]
259,0    7     4620     5.943409085 425548  P   N [questdb-ilpwrit]
259,0    7     4621     5.943410717 425548  A  RA 536514832 + 8 <- (259,7) 6699280
259,0    7     4622     5.943410836 425548  Q  RA 536514832 + 8 [questdb-ilpwrit]
259,0    7     4623     5.943411176 425548  G  RA 536514832 + 8 [questdb-ilpwrit]
259,0    7     4624     5.943411707 425548 UT   N [questdb-ilpwrit] 2
259,0    7     4625     5.943411781 425548  I  RA 536514832 + 8 [questdb-ilpwrit]
259,0    7     4626     5.943411865 425548  I  RA 536514808 + 8 [questdb-ilpwrit]
259,0    7     4627     5.943414234   264  D  RA 536514832 + 8 [kworker/7:1H]
259,0    7     4628     5.943414565   264  D  RA 536514808 + 8 [kworker/7:1H]
259,0    7     4629     5.943472169 425550  C  RA 536514808 + 8 [0]
259,0    7     4630     5.943473856 425550  C  RA 536514832 + 8 [0]
... and much-much more events
Each line here stands for a different event. For simplicity, let's consider the first line:
259,0 7 4618 5.943408644 425548 Q RA 536514808 + 8 [questdb-ilpwrit]
The relevant parts are the following:
- 425548 - this event was generated with pid 425548.
- Q RA - this event stands for a disk read request added (queued) to the I/O queue. The "A" suffix is not well documented, but it stands for potential readahead operation. We'll learn what readahead is a bit later.
- 536514808 + 8 - this read operation starts at block 536514808 and is 8 blocks in size.
- [questdb-ilpwrit] - the operation was started by a QuestDB's ILP writer thread.
Armed with this knowledge, we can use debugfs to follow the block number to
find the corresponding inode:
$ sudo debugfs -R 'icheck 536514808' /dev/nvme0n1debugfs 1.46.5 (30-Dec-2021)Block Inode number536514808 8270377
Finally, we can check what stands for the inode 8270377:
$ sudo debugfs -R 'ncheck 8270377' /dev/nvme0n1debugfs 1.46.5 (30-Dec-2021)Inode Pathname8270377 /home/ubuntu/.questdb/db/table_name/2022-10-04/symbol_col9.d.1092
These steps must be done per read event, although writing a script to automate it is easy. After looking at the events, we found that the disk reads correspond to the column files. So, while the database was writing these append-only files, somehow, we ended up with disk reads.
Another interesting fact is that the user had quite a few tables, around 50 of them, each holding a few hundred columns. As a result, the database had to cope with lots of column files. We were pretty confident that our ILP code wasn't supposed to be reading from these files but only writing to them.
Who might be reading the files? Maybe the OS?
Meet the Linux kernel
Like many other databases, QuestDB uses buffered I/O, such as
mmap,
read, and
write, to deal with disk
operations. This means that whenever we write something to a file, the kernel
writes the modified data to a number of pages in the page cache and marks them
as dirty.
The page cache is a special transparent in-memory cache used by Linux to keep recently read data from the disk and recently modified data to be written to the disk. The cached data is organized in pages that are 4KB in size on most distributions and CPU architectures.
It's also impossible to limit the amount of RAM for the page cache as the kernel tries to use all available RAM for it. Older pages are evicted from the page cache to allow new page allocation for applications or the OS. In most cases, this happens transparently for the application.
With the default cairo.commit.mode value,
QuestDB doesn't make explicit fsync/msync calls to flush the column files
data to the disk, so it entirely relies on the kernel to flush the dirty pages.
Hence, we need to understand better what to expect from the kernel before
hypothesizing on our "phantom reads" case.
As we already know, the OS doesn't write file data modifications to the disk
immediately. Instead, it writes them to the page cache. This is called the
write-back caching strategy. A write-back assumes that a background process is
responsible for writing the dirty pages back to the disk. In Linux, that's done
by pdflush, a set of kernel threads responsible for the dirty page writeback.
There are several pdflush settings available for configuring. Here are the
most significant ones:
dirty_background_ratio- while the percentage of dirty pages is less than this setting, dirty pages stay in memory until they're old enough. Once the number of dirty pages exceeds this ratio, the kernel proactively wakes uppdflush. On Ubuntu and other Linux distros, this setting defaults to10(10%).dirty_ratio- when the percentage of dirty pages exceeds this ratio, the writes are no longer asynchronous. This means that the writing process (the database process in our case) will synchronously write pages to the disk. When this happens, the corresponding thread is put into "uninterruptable sleep" status (Dstatus code intoputility). This setting usually defaults to20(20%).dirty_expire_centisecs- this defines the age in centiseconds for dirty pages to be old enough for the writeback. This setting usually defaults to3000(30 seconds).dirty_writeback_centisecs- defines the interval to wake up the pdflush process. This setting usually defaults to500(5 seconds).
The current values of the above settings can be checked via the /proc virtual
file system:
$ cat /proc/sys/vm/dirty_background_ratio10$ cat /proc/sys/vm/dirty_ratio20$ cat /proc/sys/vm/dirty_expire_centisecs3000$ cat /proc/sys/vm/dirty_writeback_centisecs500
It's also important to note that the above percentages are calculated based on
the total reclaimable memory, not the total RAM available on the machine. If
your application doesn't produce a lot of dirty pages and there is plenty of
RAM, all disk writes are done asynchronously by pdflush.
However, if the amount of memory available to the page cache is low, pdflush
would be writing the data most of the time with high chances of the application
being put into the "uninterruptable sleep" status and blocked on writes.
Tweaking these values didn't give us much. Remember that the user was writing to
a high number of columns? This means the database had to allocate some memory
per column to deal with
out-of-order
(O3) writes, leaving less memory available to the page cache. We first checked
that, and indeed most of the RAM was used by the database process. Tweaking
cairo.o3.column.memory.size from the default 16MB to 256KB helped to reduce
the disk read rate significantly, so indeed the problem had something to do with
the memory pressure. Do not worry if you don't understand this paragraph in
detail. Here is the most important bit: Decreasing the database memory usage
reduced the number of reads. That's a useful clue.
But what was the exact reason for the disk reads?
To answer this question, we need to understand the disk reading part of the page
cache better. To keep things simple, we'll focus on mmap-based I/O. As soon as
you mmap a file, the kernel allocates page table entries (PTEs) for the
virtual memory to reserve an address range for your file, but it doesn't read
the file contents at this point. The actual data is read into the page when you
access the allocated memory, i.e. start reading (LOAD instruction in x86) or
writing (STORE instruction in x86) the memory.
When this happens for the first time, the memory management unit (MMU) of your CPU signals a special event called "page fault." A page fault means that the accessed memory belongs to a PTE with no allocated physical memory. The kernel handles a page fault in two different ways:
- If the page cache already has the relevant file data in memory, perhaps belonging to the same file opened by another process, the kernel simply updates the PTE to map to the existing page. This is called a minor page fault.
- If the file data isn't cached yet, the kernel has to block the application, read the page, and only then update the PTE. This is called a major page fault.
As you might guess, major page faults are much more expensive than minor ones, so Linux tries to minimize their number with an optimization called readahead (sometimes it's also referred to as "fault-ahead" or "pre-fault").
At the conceptual level, the readahead is responsible for reading the data that the application hasn't explicitly requested. When you first access (either read or write) a few bytes of a just-opened file, a major page fault happens, and the OS reads the data corresponding to the requested page plus several pages before and after the file. This is called "read-around." If you keep accessing the subsequent pages of the file, the kernel recognizes the sequential access pattern and starts readahead, trying to read the subsequent pages in batches ahead of time.
By doing this, Linux tries to optimize for sequential access patterns as well as to increase the chances of hitting an already cached page in case of random access.
Remember the disk read event from the blktrace output? The "A" suffix in the
"RA" operation type suggested that the disk read was a part of the readahead.
However, we knew that our workload was write-only, dealing with a large number
of files. The issue was much more noticeable when there was not much memory left
for page cache purposes.
What if the pages were evicted from the page cache too early, leading to redundant readahead reads on the subsequent page access?
We can check this hypothesis by disabling the readahead. This is as simple as
making the madvise
system call with the MADV_RANDOM flag. This hint tells the kernel that the
application is going to access the mmapped file randomly, so it should disable
readahead for the mmapped file.
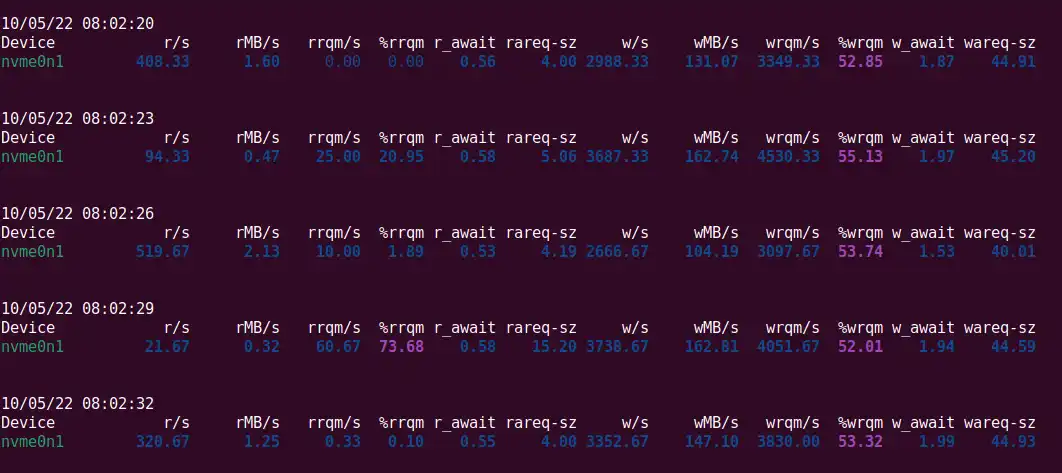
That was it! No more "phantom reads":
The happy ending
As a result, we found a sub-optimal kernel readahead behavior. Ingestion of a
high number of column files under memory pressure led to the kernel starting
readahead disk read operations, which you wouldn't expect from a write-only
load. The rest was as simple as
using madvise in our code to
disable the readahead in table writers.
What's the moral of this story? First, we wouldn't be able to fix this issue if we weren't aware of how buffered I/O works in Linux. When you know what to expect from the OS and what to check, finding and using the right utilities is trivial. Second, any user complaint, even one that is hard to reproduce, is an opportunity to learn something new and make QuestDB better.
As usual, we encourage you to try out the latest QuestDB release and share your feedback with our Community Forum. You can also play with our live demo to see how fast it executes your queries. And, of course, contributions to our open-source project on GitHub are more than welcome.