This submission comes from one of our community contributors Yitaek Hwang who has put together another excellent tutorial that shows how to use the official QuestDB Helm chart with Google's Autopilot feature on GKE. Yitaek also includes details of how to use a Prometheus exporter and automated backups to demonstrate a production-ready deploy of QuestDB.
Thanks for another great contribution, Yitaek!
Introduction
Recently, I've been experimenting with QuestDB as a primary time series database to stream and analyze IoT and financial data:
While I was able to validate the power of QuestDB in storing massive amounts of data and querying them quickly in those two projects, I was mostly running them on my laptop via Docker. To scale my experiments, I wanted to create a more production-ready setup, including monitoring and disaster recovery, on Kubernetes. So in this guide, we'll walk through setting up QuestDB on GKE with Prometheus and Velero.
Prerequisites
Before getting started with the tutorial, you will need the following:
- GCP account
- gcloud CLI for programmatic access to Google Cloud resources
- Helm 3, the package manager for Kubernetes
Setting up GKE Autopilot
As a DevOps engineer/SRE, I'm a huge fan of GKE since it provides many features out of the box, such as cluster autoscaling, network policy plugins, and managed Istio compared to other managed Kubernetes options available. Recently Google Cloud announced GKE Autopilot, a new mode that further automates Kubernetes operations, including node management, security/hardening, and resource optimization. It brings together the serverless experience of Cloud Run with the flexibility and features of GKE. In practice, this means that you are now charged for pod usage rather than paying for the compute and storage of the underlying Kubernetes nodes, making it an excellent choice for projects with unknown resource utilization.
Creating a new GKE Autopilot cluster is also extremely simple. There's no need to set up Terraform or VPCs/autoscalers/node groups. To get started, create a Google Cloud account, navigate to Google Kubernetes Engine, enable the Kubernetes Engine API, and click on Create Cluster:
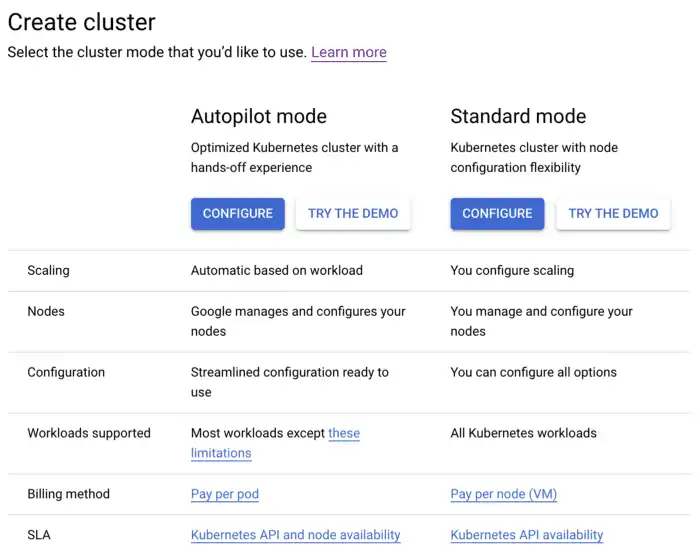
Click on the Configure button under "Autopilot mode", give the cluster a
name, and wait for a few minutes for the cluster to be ready. I went with the
default name autopilot-cluster-1 in the us-east1 region, and left the
networking and advanced configuration sections with default values. To configure
your Kubernetes context to interact with the cluster via Helm, fetch the
credentials using the following gcloud command:
gcloud container clusters \
  get-credentials autopilot-cluster-1 --region us-east1
Deploying QuestDB
QuestDB provides
an official Helm chart that
deploys a single StatefulSet pod with 50Gi PVC by default. To install the
chart, add the QuestDB Helm repo and deploy it by running the following:
helm repo add questdb https://helm.questdb.io/
helm upgrade --install questdb questdb/questdb
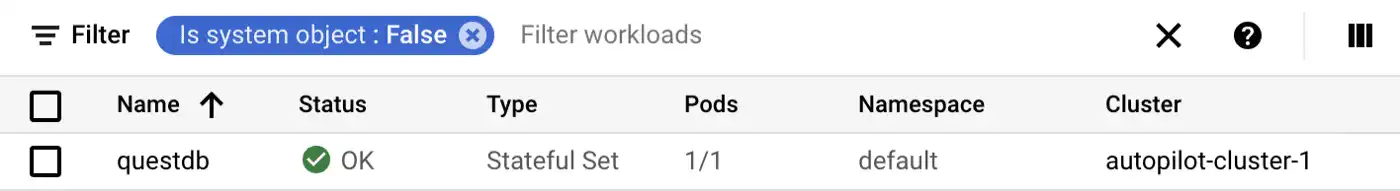
Since GKE Autopilot does not pre-provision node capacity, the pod will be initially marked as unschedulable. Give it a few seconds until cluster autoscaler triggers a scaling up event and schedules the questdb pod.
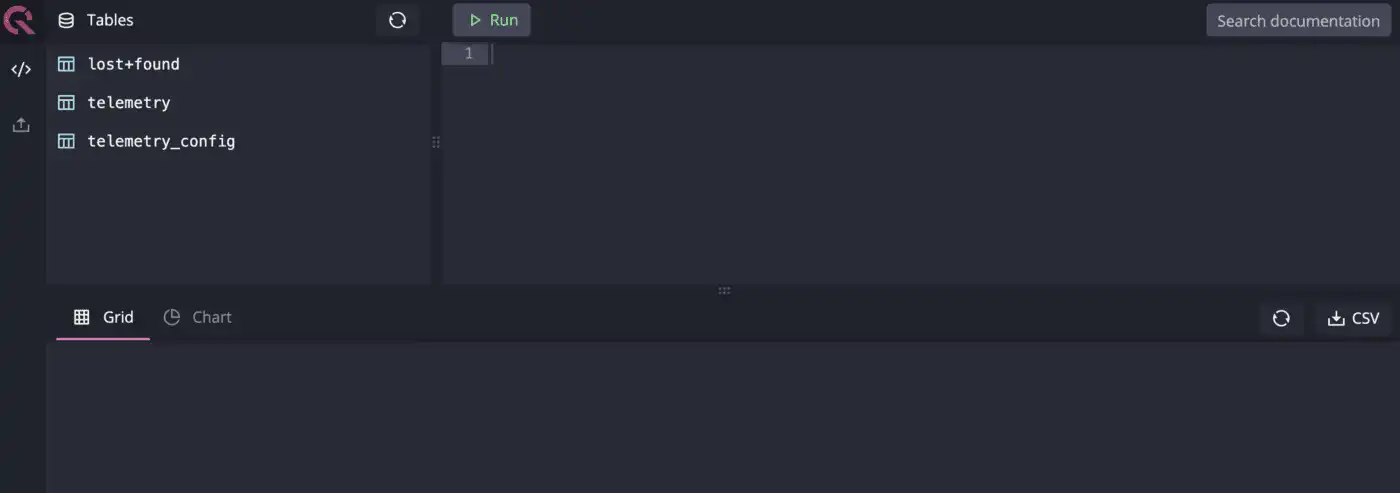
For a quick smoke test, port-forward the HTTP endpoint and interact with the web console UI:
kubectl port-forward questdb-0 9000:9000
Monitoring Postgres metrics
At this point, we have a healthy, running instance of QuestDB. However, without
inspecting the application logs, there is no easy way to determine the overall
system health and grab metrics from QuestDB. For performance reasons, QuestDB
team decided to decouple the REST endpoint from its min
HTTP server that holds a simple health status
on port 9003. This port is currently not exposed via the Helm chart, so the
StatefulSet and Service sections need to be changed to allow probes to
periodically check this endpoint.
QuestDB currently does not provide a comprehensive metrics endpoint that natively integrates with Prometheus or Postgres, but there are open GitHub issues listed below for these features:
- [#837] Add support for exposing database state similar to pg_stat_database and pg_stat_activity
- [#532] Add Prometheus metrics endpoint
I wanted to deploy Prometheus Postgres Exporter to at least track QuestDB up/down status and set up the framework to monitor Postgres metrics once these features become available.
Expose Postgres port
First, we need to modify the default QuestDB chart to expose port 8812 which
is the default Postgres endpoint. Create a new YAML file called
questdb-values.yaml with the following contents:
service:
  expose:
    postgresql:
      enabled: true
      port: 8812
And pass this config file using Helm to update the existing deployment:
helm upgrade --install questdb questdb/questdb -f questdb-values.yaml
Install Prometheus Postgres exporter
Prometheus Helm charts are maintained by the Prometheus community:
helm repo add prometheus-community https://prometheus-community.github.io/helm-charts
Next, we need to modify the default values to scrape QuestDB and also disable
default metrics since QuestDB doesn't currently expose pg_stat_database or
pg_stat_activity. We also want Prometheus to scrape our metrics, so we need to
add annotations and specify our scrape port. Create another YAML file called
exporter-values.yaml with the following contents:
config:
  datasource:
    host: questdb-0.questdb-headless
    user: admin
    password: quest
    port: "8812"
    database: qdb
    sslmode: disable
  disableDefaultMetrics: true
  annotations:
    prometheus.io/scrape: "true"
    prometheus.io/port: "9187"
Now we can pass this file via Helm to install the Postgres exporter:
helm upgrade -i postgres-exporter prometheus-community/prometheus-postgres-exporter -f exporter-values.yaml
Finally, we can install Prometheus to collect these metrics. Create a new YAML
file to hold our Prometheus configurations called prometheus-values.yaml:
alertmanager:
  enabled: false
nodeExporter:
  enabled: false
pushgateway:
  enabled: false
Since we don't have many metrics from QuestDB yet, we will only deploy the Prometheus server and accept the default configuration:
helm upgrade -i prometheus prometheus-community/prometheus -f prometheus-values.yaml
Access the Prometheus dashboard using port-forwarding to run some example queries:
export POD_NAME=$(kubectl get pods --namespace default -l \ "app=prometheus,component=server" -o jsonpath="{.items[0].metadata.name}")
kubectl --namespace default port-forward $POD_NAME 9090
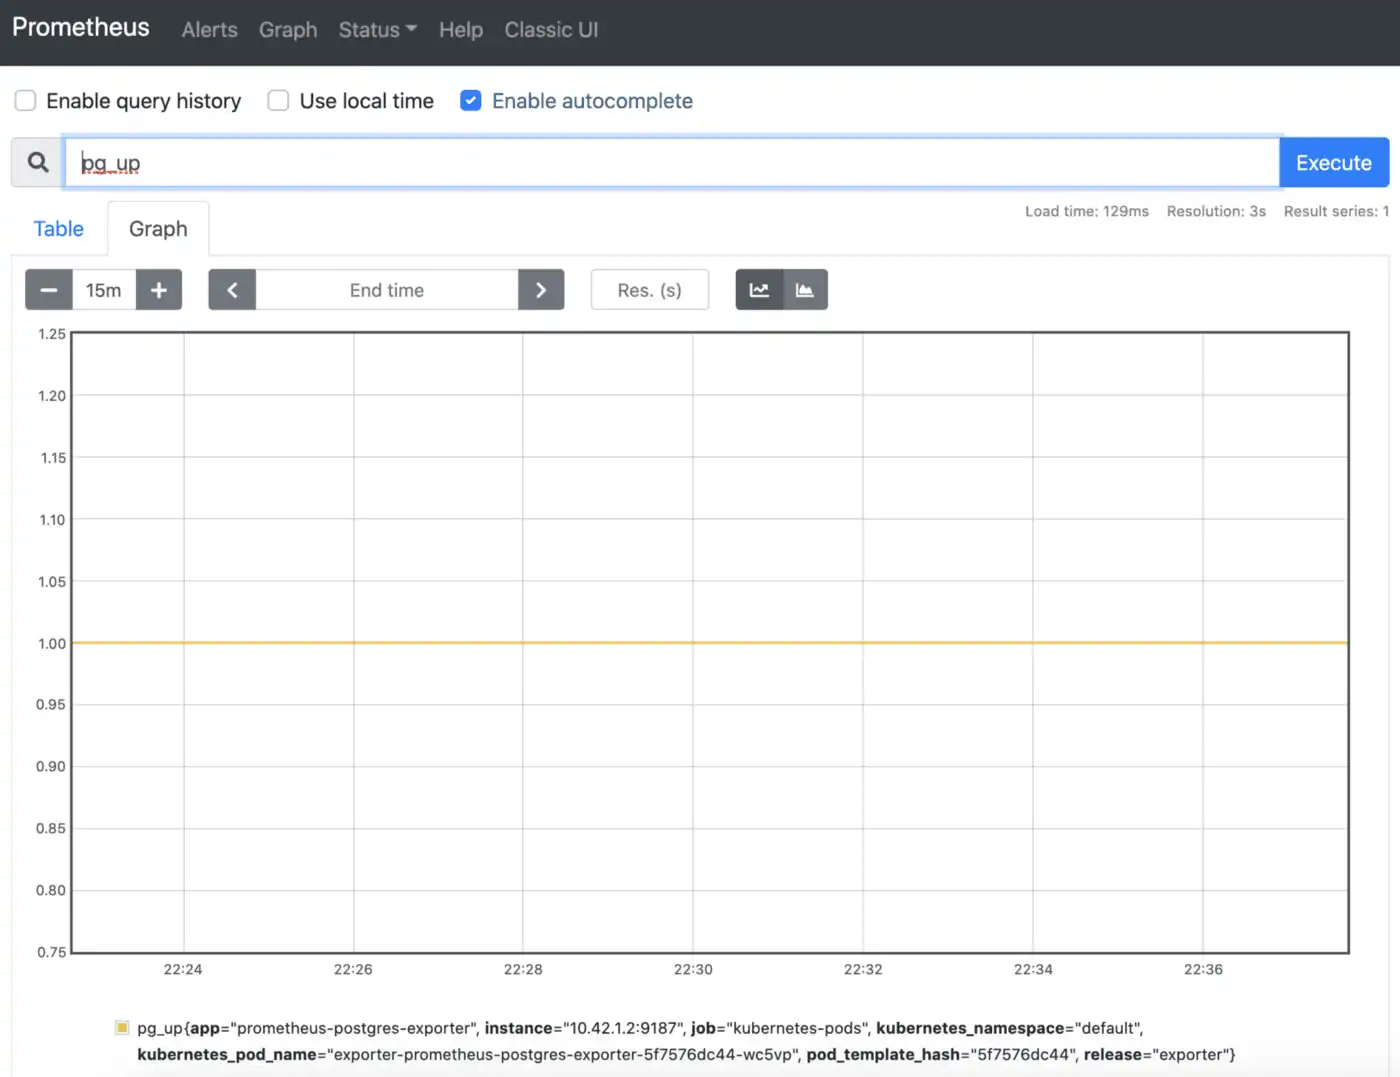
Once port-forwarding is active, visit
http://localhost:3000 and check that we're able to
scrape pg_up:
If you are looking for a production-ready monitoring setup, please refer to my four-part series Practical monitoring with Prometheus and Grafana.
Automated Velero backups
Velero is an open-source tool to back up and restore Kubernetes resources and persistent volumes which is useful for disaster recovery (taking snapshots) or data migration. Velero runs inside the Kubernetes cluster and integrates with various storage providers (e.g., AWS S3, GCP Storage, Minio) as well as restic to take snapshots either on-demand or on a specified schedule.
Installation
Velero can be installed via Helm or via the official CLI tool. In general, it seems like the CLI gets the latest updates, and the Helm chart lags behind slightly with compatible Docker images.
# for MacOS
brew install velero
# for Windows
choco install velero
Velero configuration
To set up Velero on GCP, we need to:
GCS bucket storage
Provide a unique bucket name and use the gsutil tool to create a bucket.
Replace <YOUR_BUCKET> with the name of the bucket and run the following
command:
PROJECT_ID=$(gcloud config get-value project) BUCKET=<YOUR_BUCKET> gsutil mb gs://$BUCKET/
Create a service account:
gcloud iam service-accounts create velero \
  -—display-name "Velero service account"
Attach the compute permissions to the service account:
SERVICE_ACCOUNT_EMAIL=$(gcloud iam service-accounts list \
  --filter="displayName:Velero service account" \
  --format 'value(email)')ROLE_PERMISSIONS=(
    compute.disks.get
    compute.disks.create
    compute.disks.createSnapshot
    compute.snapshots.get
    compute.snapshots.create
    compute.snapshots.useReadOnly
    compute.snapshots.delete
    compute.zones.get
)

gcloud iam roles create velero.server \
    --project $PROJECT_ID \
    --title "Velero Server" \
    --permissions "$(IFS=","; echo "${ROLE_PERMISSIONS[*]}")"

gcloud projects add-iam-policy-binding $PROJECT_ID \
    --member serviceAccount:$SERVICE_ACCOUNT_EMAIL \
    --role projects/$PROJECT_ID/roles/velero.server

gsutil iam ch serviceAccount:$SERVICE_ACCOUNT_EMAIL:objectAdmin gs://${BUCKET}
Download the service account key and save it as credentials-velero:
gcloud iam service-accounts keys create credentials-velero \
    --iam-account $SERVICE_ACCOUNT_EMAIL
Now we can install Velero with the GCS plugin enabled:
velero install \
    --provider gcp \
    --plugins velero/velero-plugin-for-gcp:v1.1.0 \
    --bucket $BUCKET \
    --secret-file ./credentials-velero
Finally, we can create a schedule using a cron-like expression:
velero schedule create \
  questdb --schedule "0 7 * * *" \
  -l "app.kubernetes.io/instance=questdb" \
  --include-namespaces default
Lastly, verify backups are being made in our bucket:
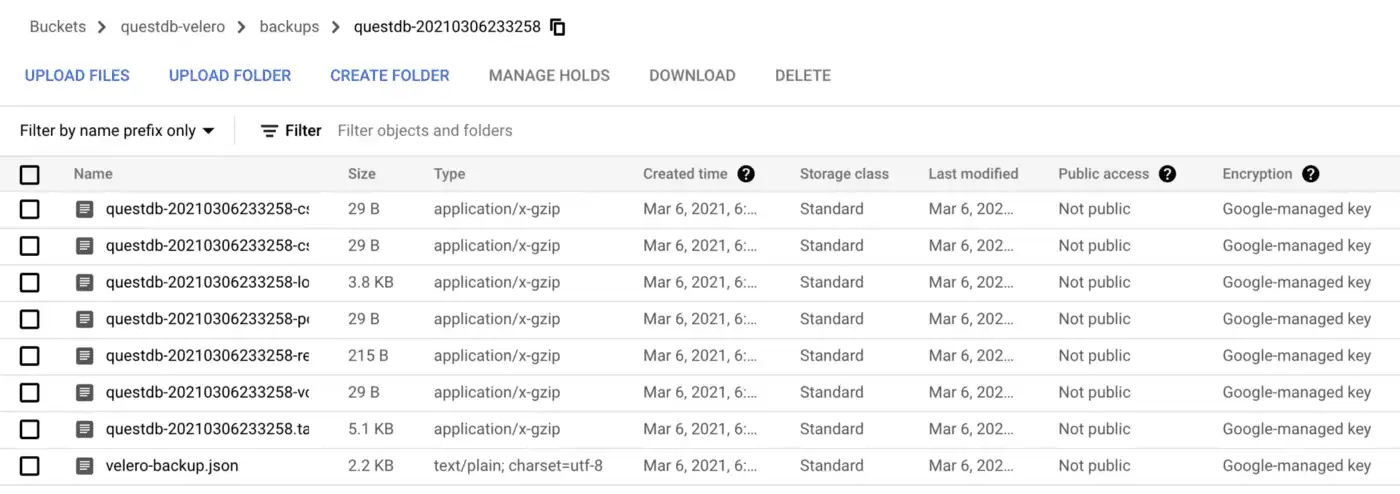
For more information on Velero, my article about disaster recovery on Kubernetes provides a deep-dive into the service features and describes why you should check it out.
Next steps
To optimize for performance, QuestDB decided to build a time series database from scratch with ANSI SQL compatibility, as opposed to building on top of Postgres like TimescaleDB. As a newer product, QuestDB is working on enterprise features (e.g., replication, high-availability, recovery from snapshot) and integrations with other popular projects. With the Prometheus Postgres exporter and Velero, we can configure a production-ready QuestDB instance on Kubernetes. I look forward to enhancing this setup in future releases when QuestDB adds more monitoring and DevOps features.
If you like this content, we'd love to know your thoughts! Feel free to share your feedback or just come and say hello in the community forums.