Whether you are just starting to work with a specific data set or monitoring activities and reports based on existing data sets, one of the first things you need to consider is the quality of the data you're dealing with. Continuity is one of the most critical factors in gauging the quality of time-series data. Time-series systems usually serve use cases where data needs to be consumed, processed, and acted upon with urgency.
Take the example of a public transport vehicle. For the safety of passengers and the timeliness of the service, vehicles need their various sensors - GPS, proximity sensors, pressure sensors, engine diagnostics sensors, and so on. Continuously using the data from these sensors helps the public transport service guarantee timeliness, safety, and reliability. However, a break in the data coming from these sensors would mean that there’s a problem.
Most data access frameworks, including query languages and importable libraries, allow you to filter and see columns or rows where data is missing. The concept of data continuity and completeness isn't more relevant anywhere than when you're talking about time-series data. By definition, time-series data needs to be continuous. However, the granularity of the continuum might differ for different requirements.
When you have to test your data for completeness in a
relational database, you often have to write
complex SQL queries paired with intermediate or temporary tables to find missing
data. In some cases, these queries can be tedious and non-performant. QuestDB is
a time-series database that lets you store
and consume your data in tabular form, but it's not what you would call a
traditional relational database. To cater to the time-series workloads, QuestDB
extends the standard SQL functionalities using SQL extensions. One of these
extensions is the SAMPLE BY extension, which
allows you to find and deal with missing data with ease.
This tutorial will take you through how to use QuestDB's SQL extensions to find gaps in your data without any complex queries or overhead.
Dataset
To demonstrate finding gaps in time-series data, we'll be using the trades
dataset, which is readily available on the
QuestDB demo website. The trades dataset contains
real-time anonymized trades data for Bitcoin and Ethereum in US Dollars from 8th
March 2022 till date. Here's the table structure of the trades dataset:
CREATE TABLE 'trades' (
 symbol SYMBOL capacity 256 CACHE,
 side SYMBOL capacity 256 CACHE,
 price DOUBLE,
 amount DOUBLE,
 timestamp TIMESTAMP
) timestamp (timestamp) PARTITION BY DAY;
For more details about the dataset and the process used to ingest data into
QuestDB, please see the article
'Demo of live crypto data streamed with QuestDB and Grafana'.
Now that you understand the structure and contents of the trades dataset,
let's try to figure out if anything is missing.
Finding missing data
Using QuestDB
As mentioned earlier in the article, you can use SQL extensions to find missing data in QuestDB. There are three keywords (or SQL keyphrases) you need to know that are unique to QuestDB:
SAMPLE BYallows you to create groups and buckets of data based on time ranges.FILLoption allows you to specify a fill behaviour when usingSAMPLE BY, which, in turn, allows you to perform time-series interpolation on the data.ALIGN TO CALENDARallows you to align your time buckets to a calendar date based on a timezone or an offset.
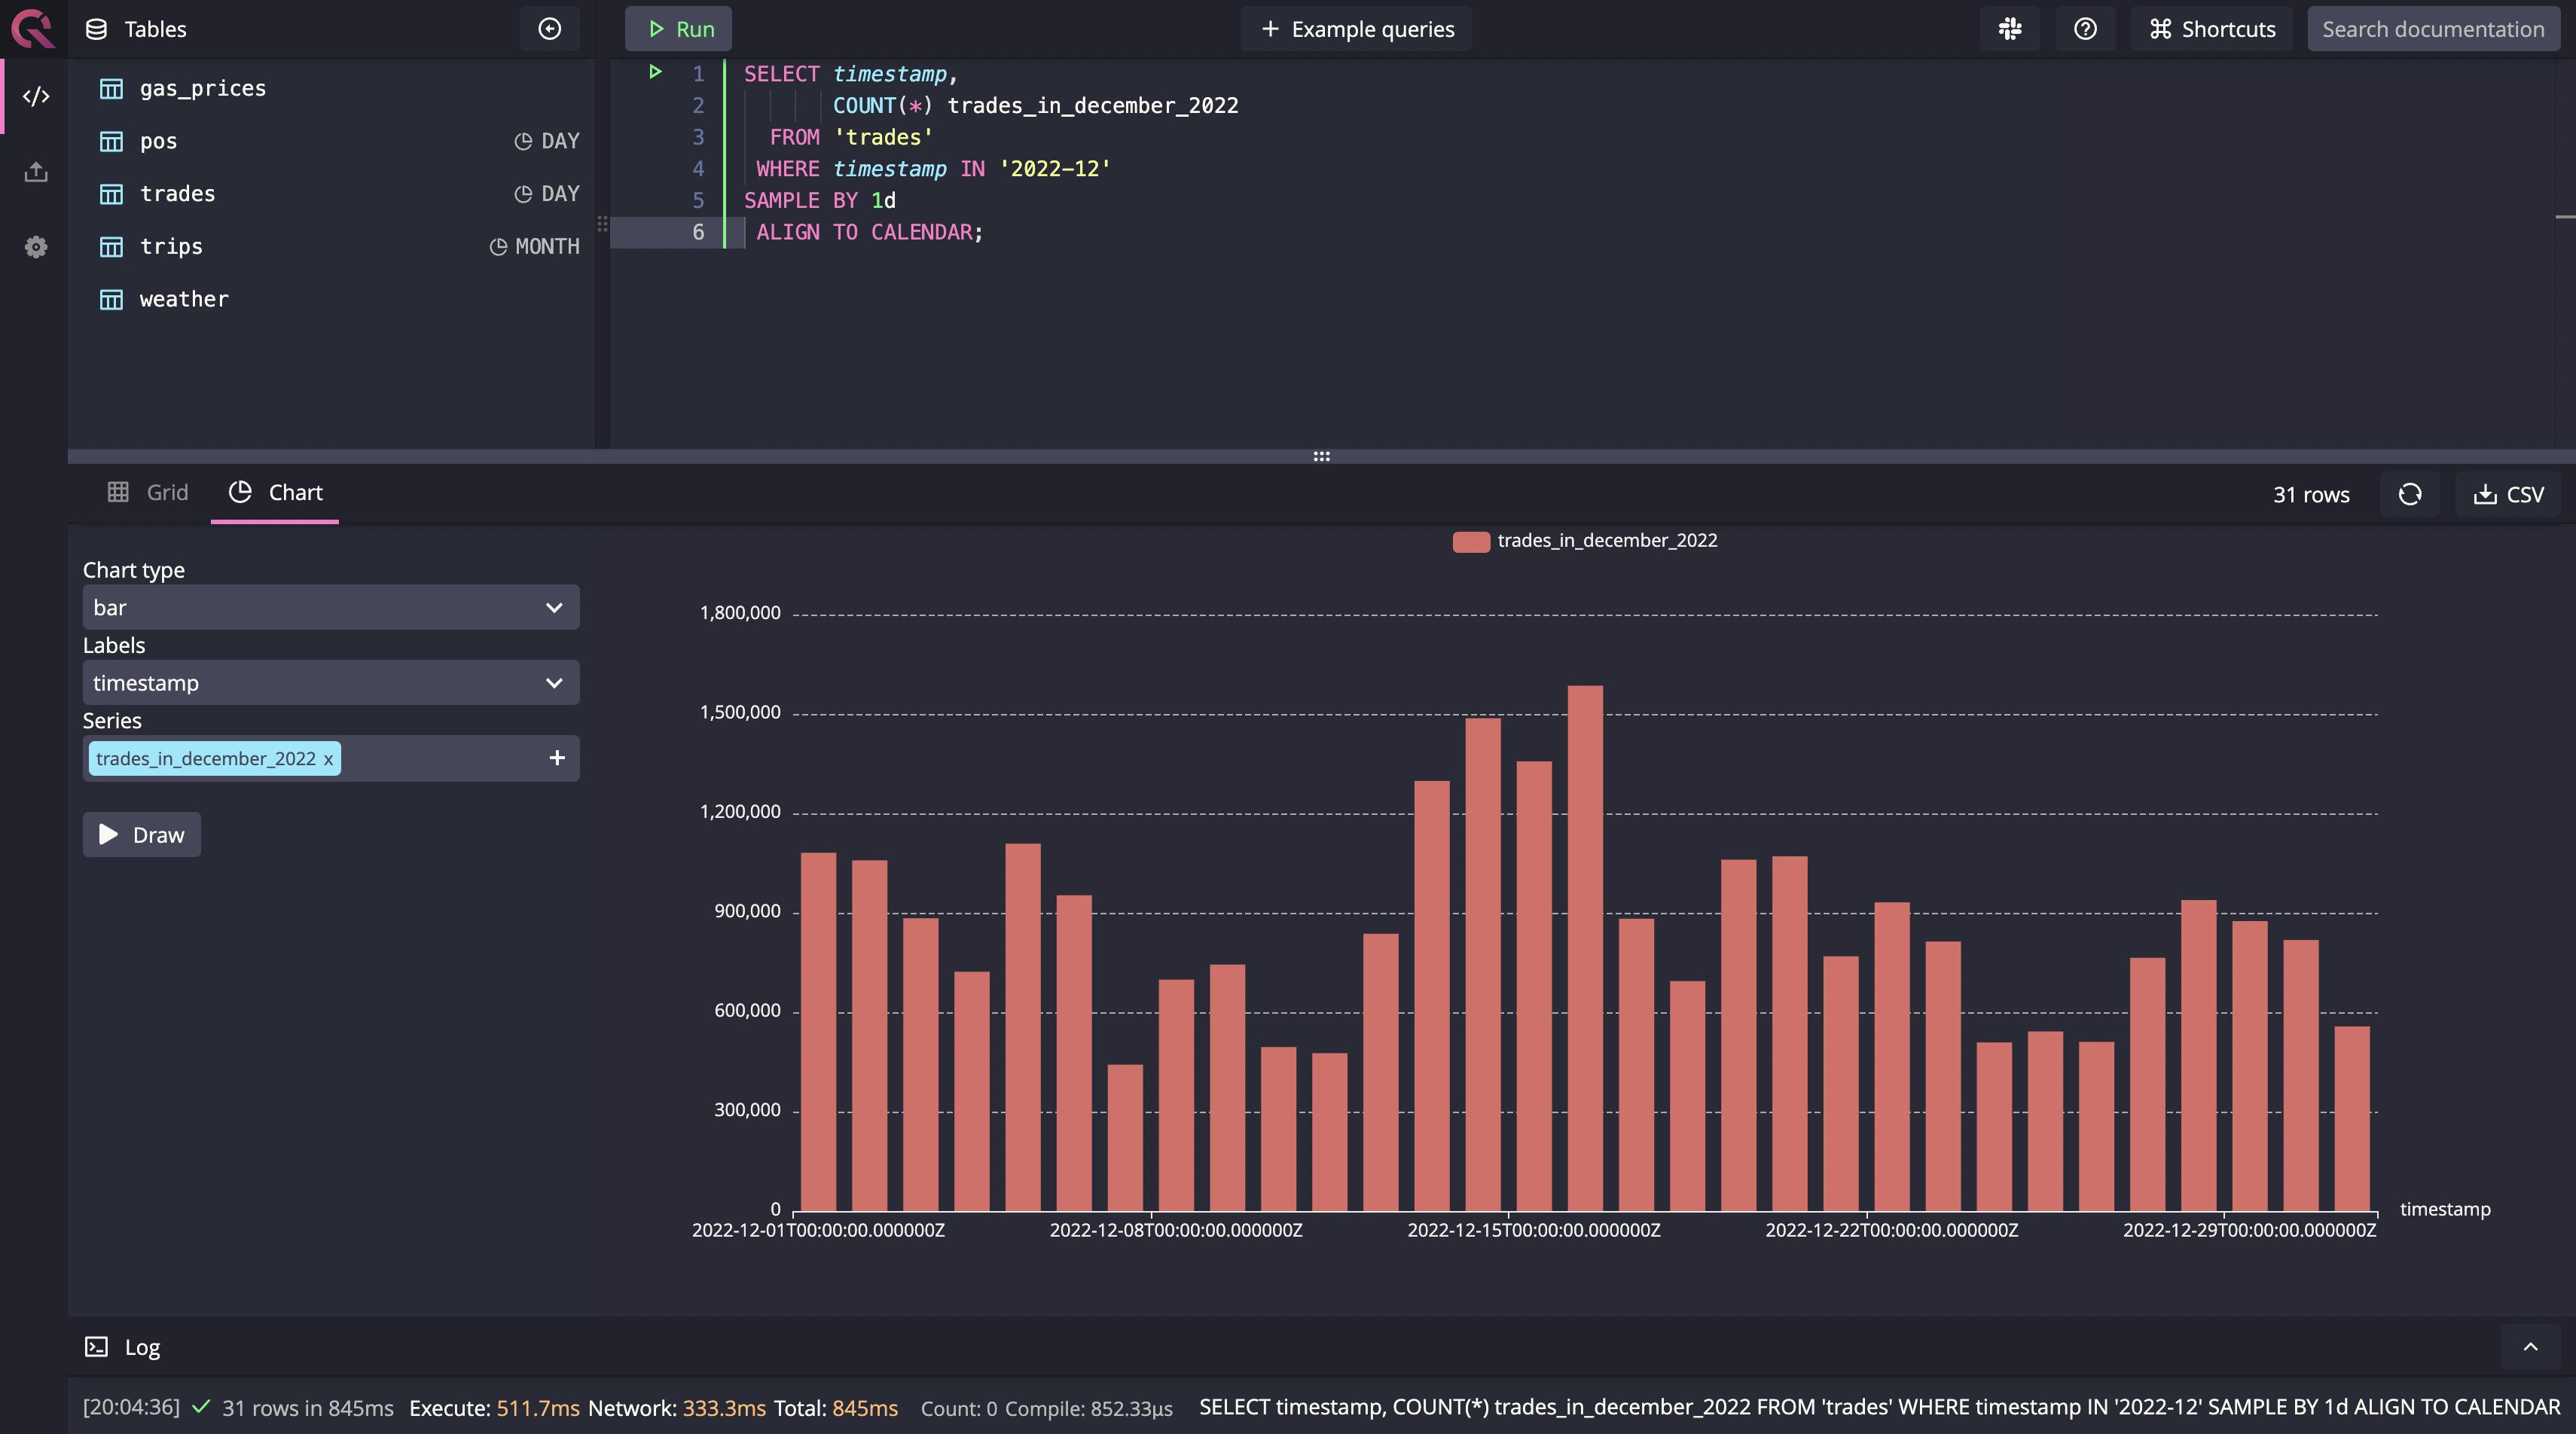
You can find missing data using a combination of the aforementioned SQL extensions. First, let's look at a basic query using these extensions to get a day-on-day count of trades in December till date this year, using the following query:
SELECT timestamp,
       COUNT(*) trades_in_december_2022
  FROM 'trades'
 WHERE timestamp IN '2022-12'
SAMPLE BY 1d
 ALIGN TO CALENDAR;
Running this query gives us the following output when selecting “Draw” in the Chart view:
Note that running such a simple aggregate query on low granularity is possible on any database. It only becomes a problem with other databases when the data is too granular, especially in real time. Now that it's clear how to use the SQL extensions you need, let's move on to our query that finds missing data.
In the query, we'll find the volume-weighted average price (VWAP) indicator for
the trades dataset. The key idea is to get all the timestamps where we don't
have data to calculate VWAP for all the Bitcoin trades from the starting date of
the dataset till now. In the following query, you can see that the trades are
sampled by 1 second using the SAMPLE BY 1s statement:
WITH extract AS (
SELECT timestamp,
       ROUND(SUM(price * amount) / SUM(amount),2) AS vwap_price,
       ROUND(SUM(amount),2) AS volume
  FROM trades
 WHERE symbol = 'BTC-USD'
   AND timestamp > DATEADD('d', -1, NOW())
SAMPLE BY 1s
 ALIGN TO CALENDAR)
SELECT timestamp,
       vwap_price,
       volume
  FROM extract
 WHERE vwap_price IS NULL
    OR vwap_price = 0;
However, the query doesn't result in anything, as shown in the image below:
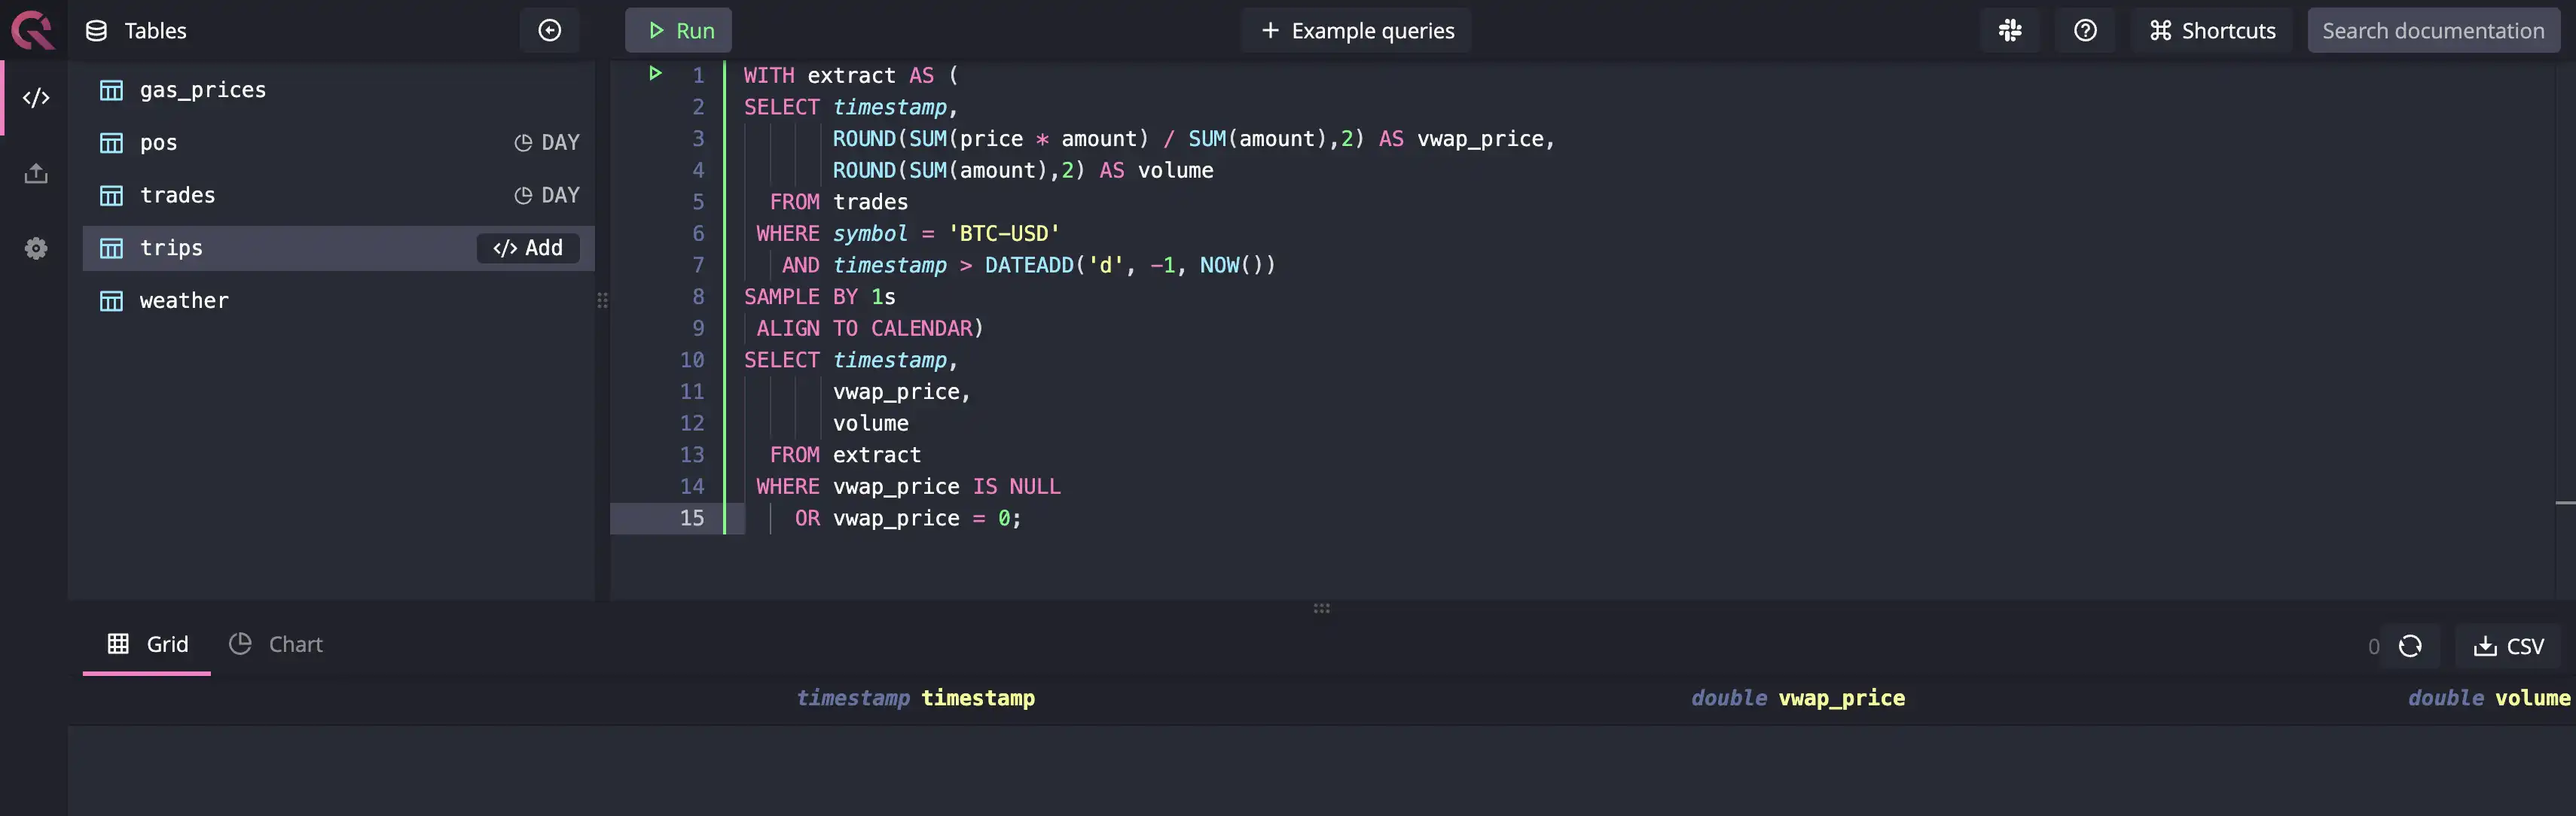
Why? Because QuestDB won't return anything if there's no data for a timestamp or
timestamp range based on the SAMPLE BY aggregator. To get the missing data
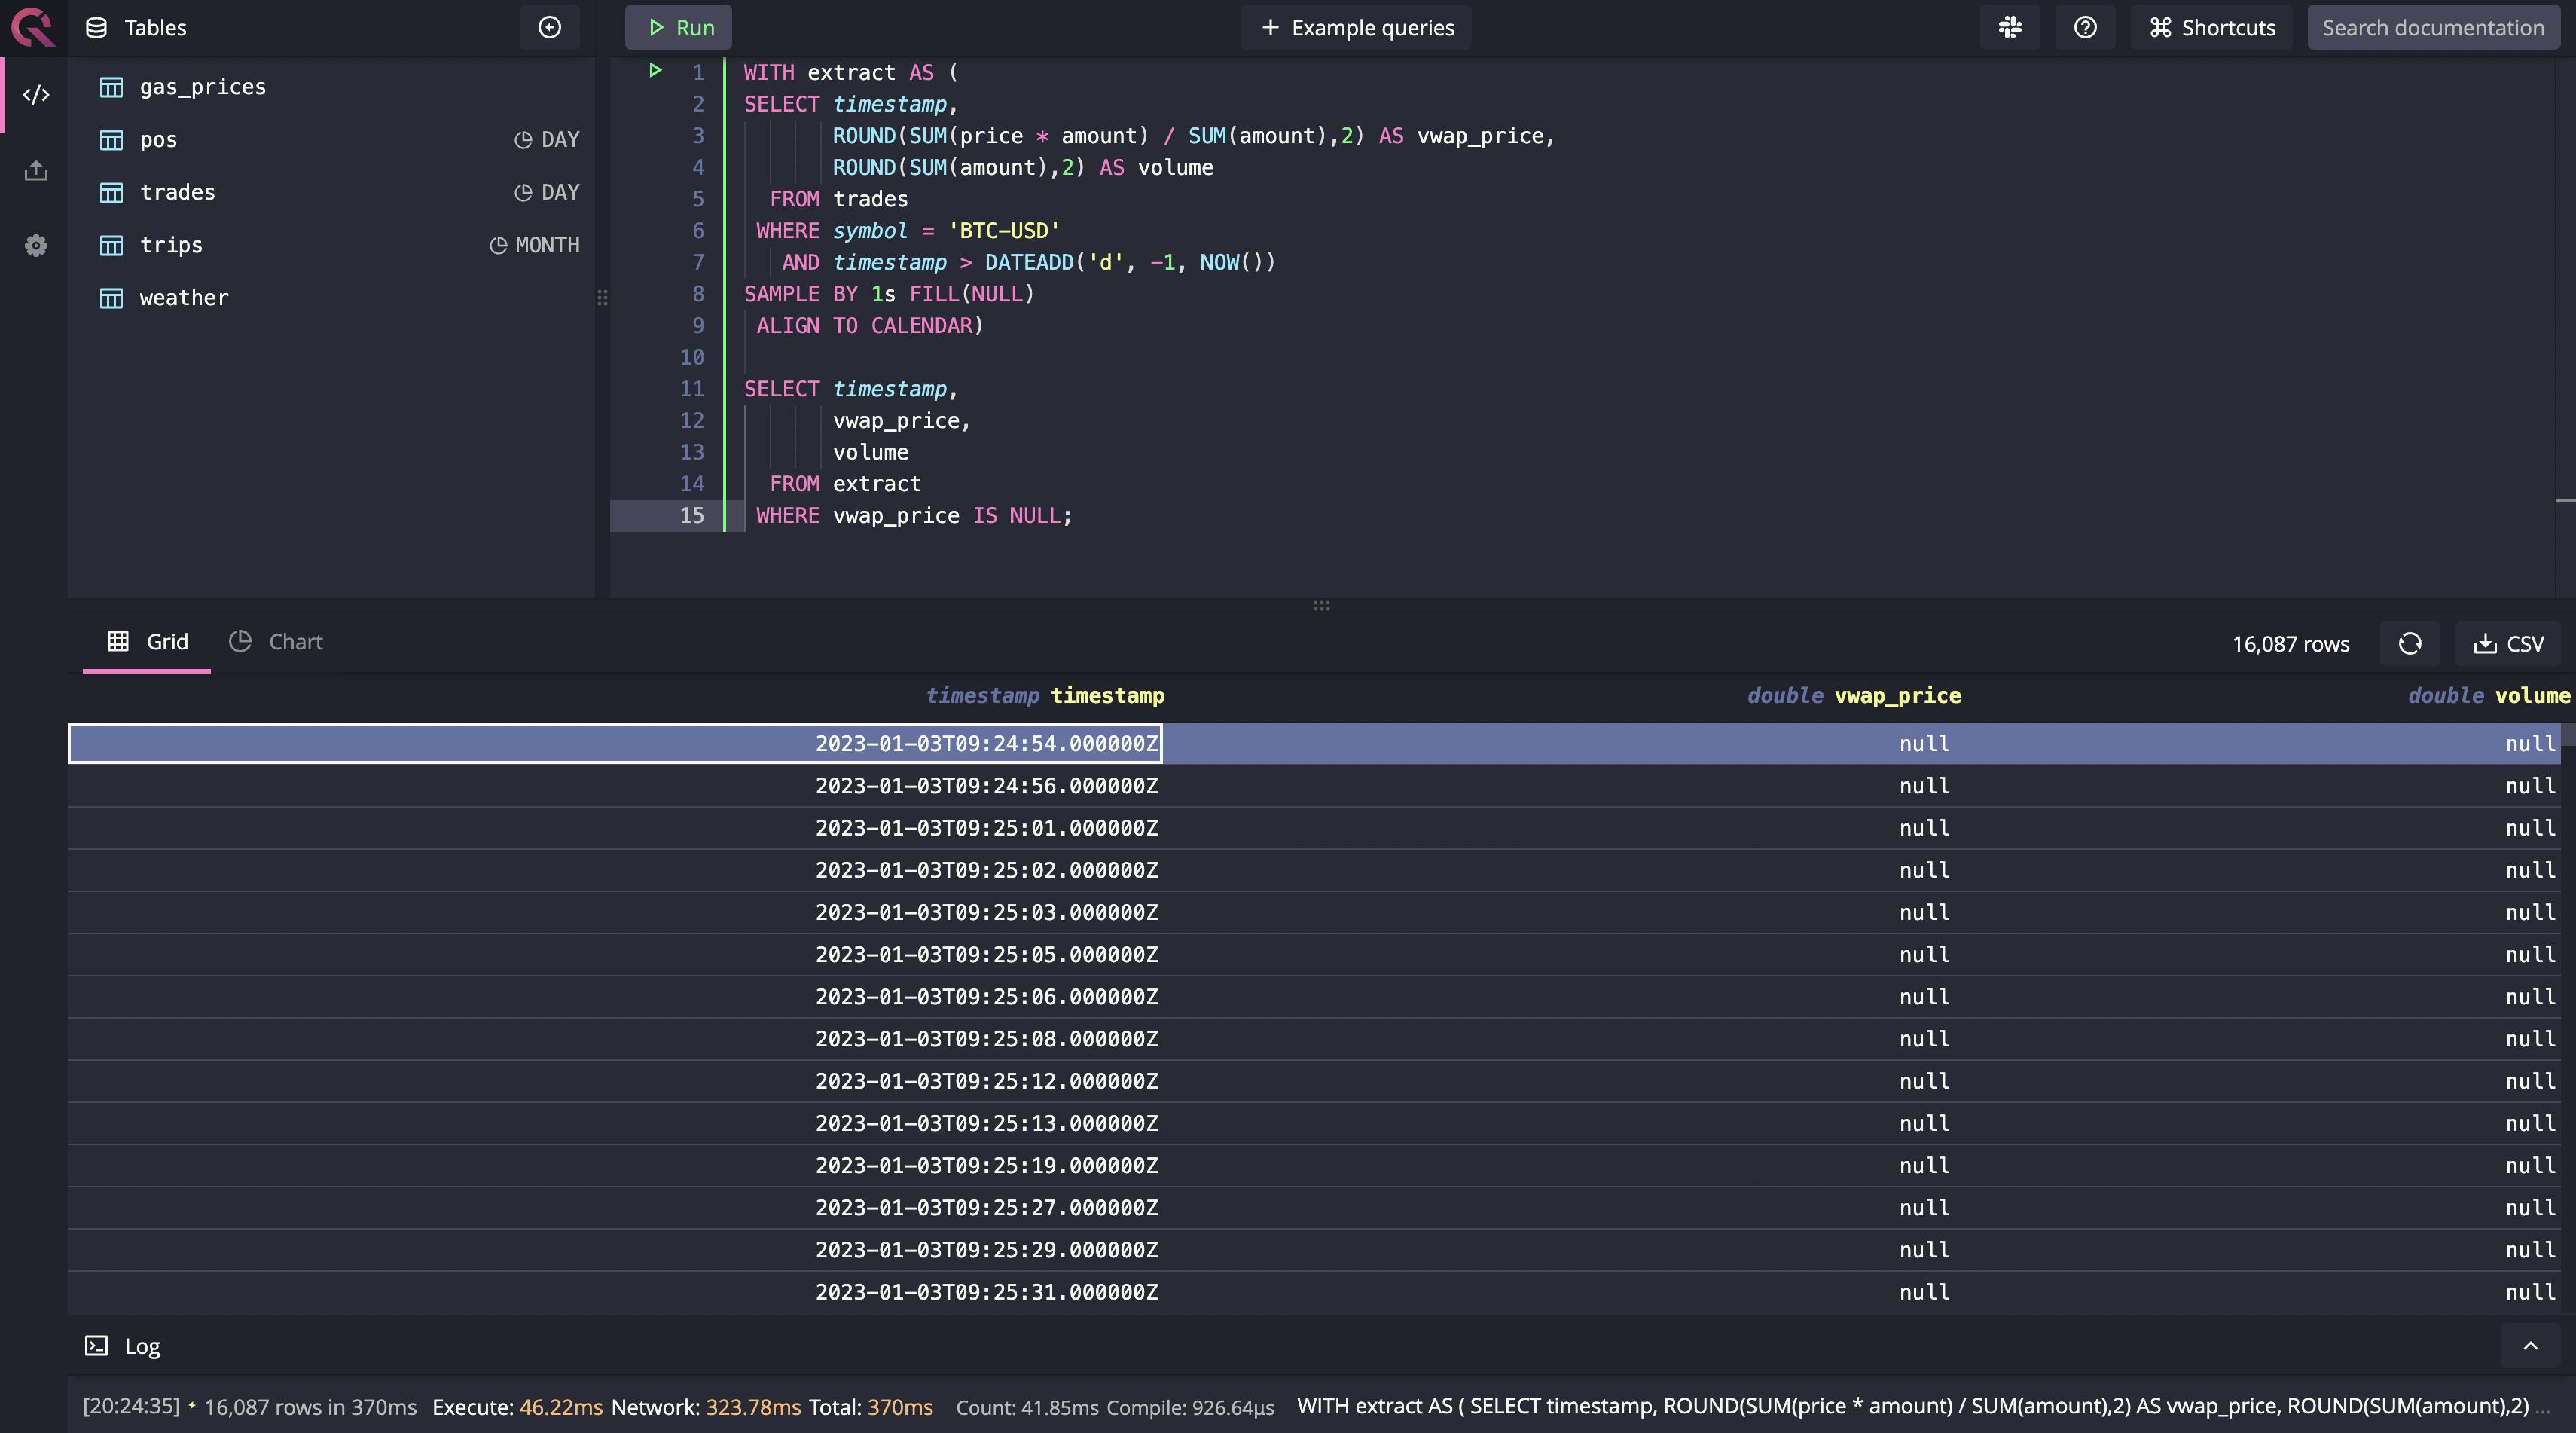
from the results, you will need to use the FILL keyword like this:
SAMPLE BY 1s FILL(NULL);
Using this, you can force-fill all the zero-value records for vwap_price with
NULL. The complete query for finding missing data will look something like the
following:
WITH extract AS (
SELECT timestamp,
       ROUND(SUM(price * amount) / SUM(amount),2) AS vwap_price,
       ROUND(SUM(amount),2) AS volume
  FROM trades
 WHERE symbol = 'BTC-USD'
   AND timestamp > DATEADD('d', -1, NOW())
SAMPLE BY 1s FILL(NULL)
 ALIGN TO CALENDAR)

SELECT timestamp,
       vwap_price,
       volume
  FROM extract
 WHERE vwap_price IS NULL;
When you run the query, you will get all the 1s windows where the data was missing, as shown in the image below:
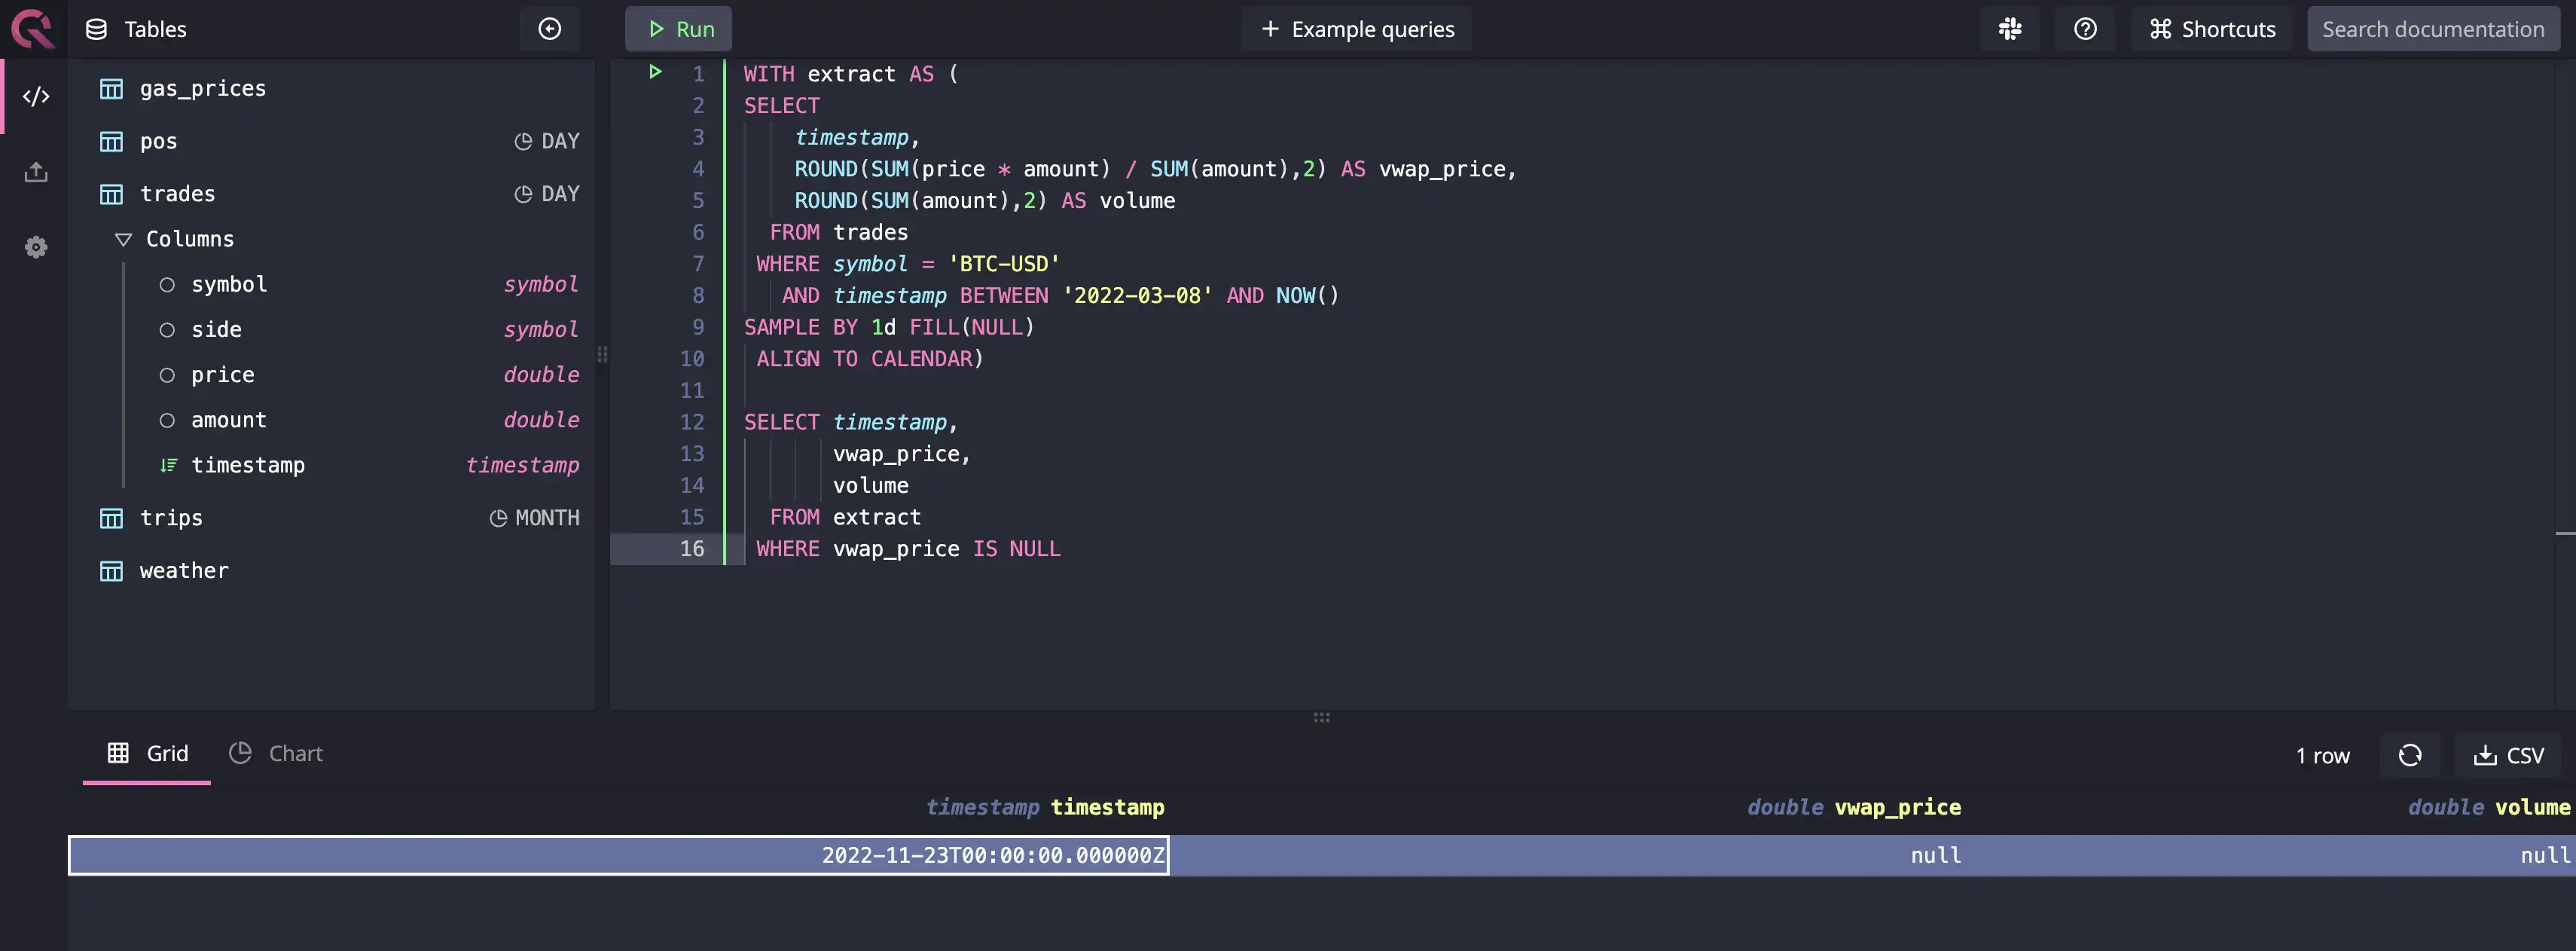
Again, there is no denying that running one-off, ad-hoc queries that aggregate on lower granularity dimensions, such as 1d or 1m, might not be that hard to do in other databases. However, if you want to keep running these queries at scale, they can create performance issues in your traditional relational database. You can get similar results in other databases if you want to find missing data daily, as shown in the image below:
If you had to perform the same operation in a PostgreSQL database, you'd need to
run a generate_series() function to generate a bunch of data and then join it
with the trades dataset. For the sake of simplicity, let's assume that the
timestamp format generated by both systems will be the same. To identify gaps in
PostgreSQL, you'll need to write something like this:
WITH all_seconds AS (
 SELECT *
   FROM generate_series('2022-12-17 00:00:00', '2022-12-17 23:59:59',
                        INTERVAL '1 second') dummy_timestamp)

SELECT *
  FROM (SELECT s.dummy_timestamp,
               ROUND(SUM(t.price * t.amount) / SUM(t.amount),2) AS vwap_price,
               ROUND(SUM(t.amount),2) AS volume
          FROM all_seconds AS s
          LEFT JOIN trades AS t
            ON s.dummy_timestamp = t.timestamp
         GROUP BY s.dummy_timestamp)
 WHERE t.vwap_price IS NULL
PostgreSQL has the advantage of having a generator function that supports all kinds of dummy data generation use cases, as you witnessed above. Not all databases have this function. In MySQL, for instance, you'd have to use recursive common table expressions (CTEs) to get the job done. In some other databases, it might be even more troublesome.
How does finding missing data help?
Identifying missing data is of utmost importance because it can tremendously impact the accuracy and reliability of every system or person that consumes it. When it comes to time-series databases, many use cases come to mind, especially those that involve edge computing devices and IoT devices, such as sensors and detectors.
Take the example of sensors that send data about critical systems in industrial machinery, such as vibration, vibration, torque, pressure, and so on. Data coming from many of these sensors not only help improve machine efficiency but also helps detect early signs of possible machine failures. In many cases, this data might help improve safety and reliability too. If the continuous stream of time-series data is broken, i.e., the data is missing, the aforementioned benefits of having real-time data go down the drain - and can cause more damage than intended as a lot ride on the reliability of these systems. This is why there's real value in identifying missing data, and QuestDB makes it super easy.
Conclusion
Continuing our SQL extensions theme, this tutorial walked you through finding
missing data using SAMPLE BY, FILL, and ALIGN BY CALENDAR keywords with
simple and highly performant queries. This article also explored some benefits
of identifying missing data, especially in time-series datasets. Now, it's time
for you to give this a shot. There's a system ready for you on the
demo website. Take it for a ride!