Benchmarking database performance with time series workloads
When looking at multiple solutions for storing and analyzing large amounts of time series data, it's common to see many open source systems claim to be the easiest to maintain or are the fastest and most efficient at storing and writing data. Reliable comparisons are one of the best ways for users to make the decision which system fits their needs in terms of resource usage, speed, ease of use and other requirements.
We decided to make it more transparent for developers to choose the right time series database by providing support for testing and measuring database performance that anyone can replicate.
How is database performance measured?
While there are many ways to measure database performance, we saw the Time Series Benchmark Suite (TSBS) regularly coming up in discussions about time series databases and decided we should provide the ability to benchmark QuestDB along with other systems.
The TSBS is a collection of Go programs to generate datasets and then benchmark read and write performance. It was initially released by InfluxDB engineers and continuously improved by the TimescaleDB team. The suite is extensible so that different types of data and query types can be included and compared across systems.
How to use the time series benchmark suite
Data for the QuestDB benchmarks is generated in InfluxDB line protocol format where each reading is composed of the table name, several comma-separated tags, several comma-separated fields, and a timestamp for the record. An example reading looks like the following:
diagnostics,name=truck_3985,fleet=West,driver=Seth,model=H-2,device_version=v1.5 load_capacity=1500,fuel_capacity=150,nominal_fuel_consumption=12,fuel_state=0.8,current_load=482,status=4i 1451609990000000000
The data generation tool is configurable so that the number of simulated devices
can be increased using scale, and the overall timespan that devices are
generating test data can be specified by a start and end timestamp:
tsbs_generate_data \
--use-case="cpu-only" --seed=123 --scale=4000 \
--timestamp-start="2016-01-01T00:00:00Z" --timestamp-end="2016-01-02T00:00:00Z" \
--log-interval="10s" --format="influx" > /tmp/data
This will create a data set approximately 12GB in size with:
- 24 hours worth of data
- 4000 simulated host machines
- each simulated host reports system metrics every 10 seconds
- records are in InfluxDB line protocol format with 10 tags and 10 fields per row
The Time Series Benchmark Suite provides a separate tool for loading the
generated data set into different databases. Users can test ingestion
performance using the tsbs_load and specify which system to send the test data
to:
tsbs_load_questdb --file /tmp/data --workers 4
Time Series Benchmark Suite results
Here are our results of the benchmark with the cpu-only use case using up to
fourteen workers on an AWS EC2 m5.8xlarge instance with sixteen cores.
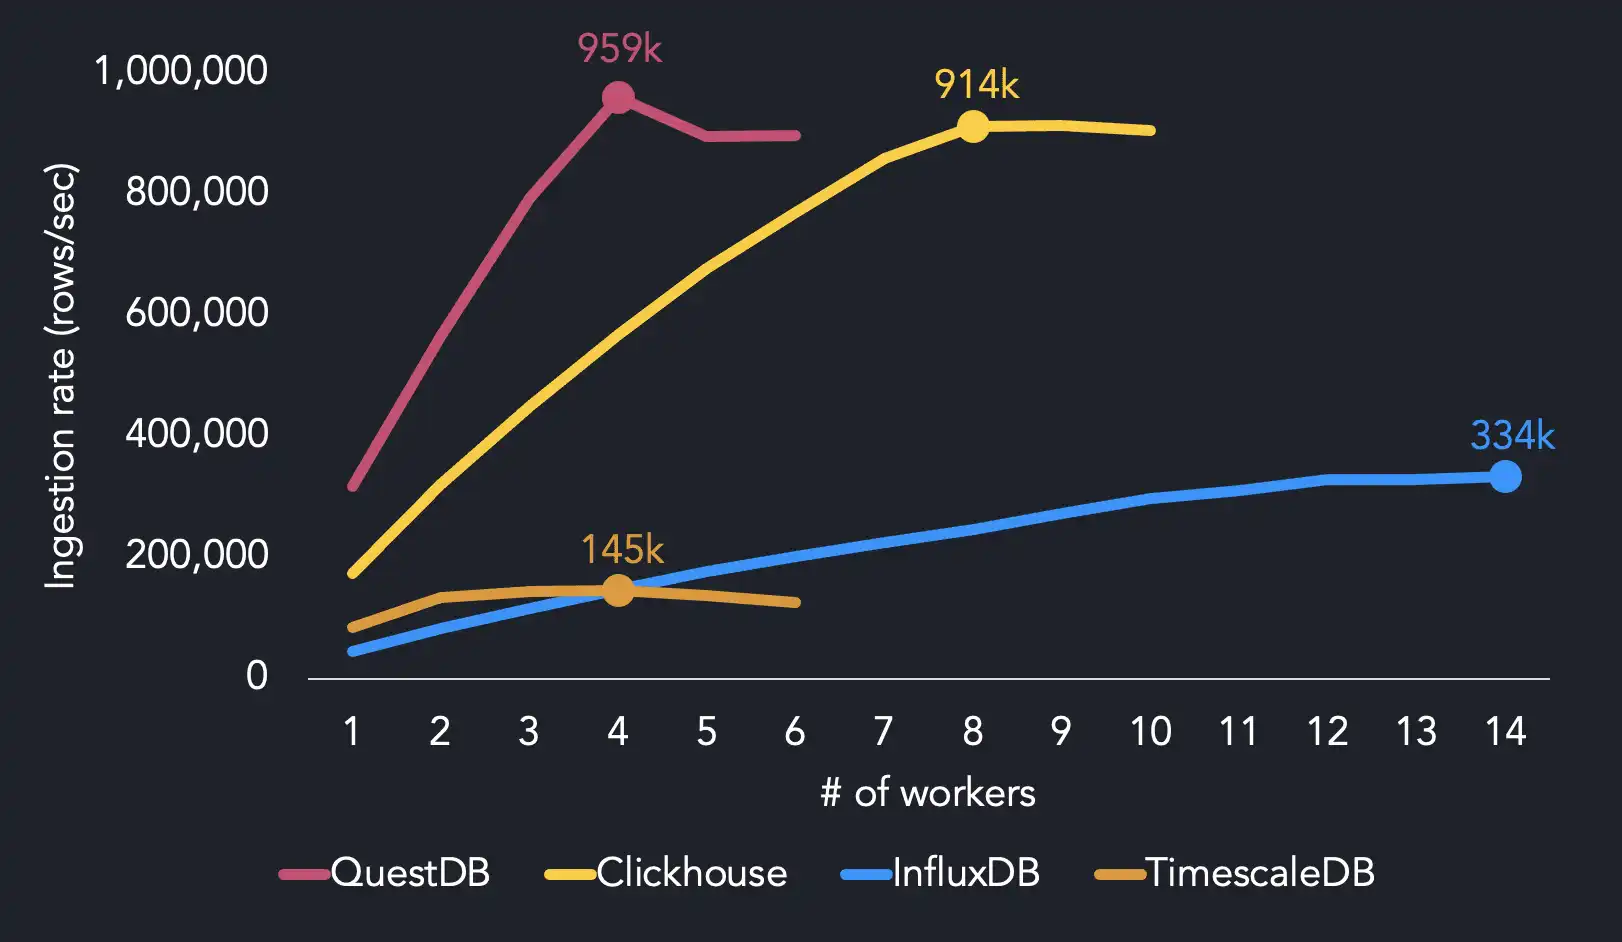
We reach maximum ingestion performance using four threads, whereas the other systems require more CPU resources to hit maximum throughput. QuestDB achieves 959k rows/sec with 4 threads. We find that InfluxDB needs 14 threads to reach its max ingestion rate (334k rows/sec), while TimescaleDB reaches 145k rows/sec with 4 threads. ClickHouse hits 914k rows/sec with twice as many threads as QuestDB.
When running on 4 threads, QuestDB is 1.7x faster than ClickHouse, 6.4x faster than InfluxDB and 6.5x faster than TimescaleDB.
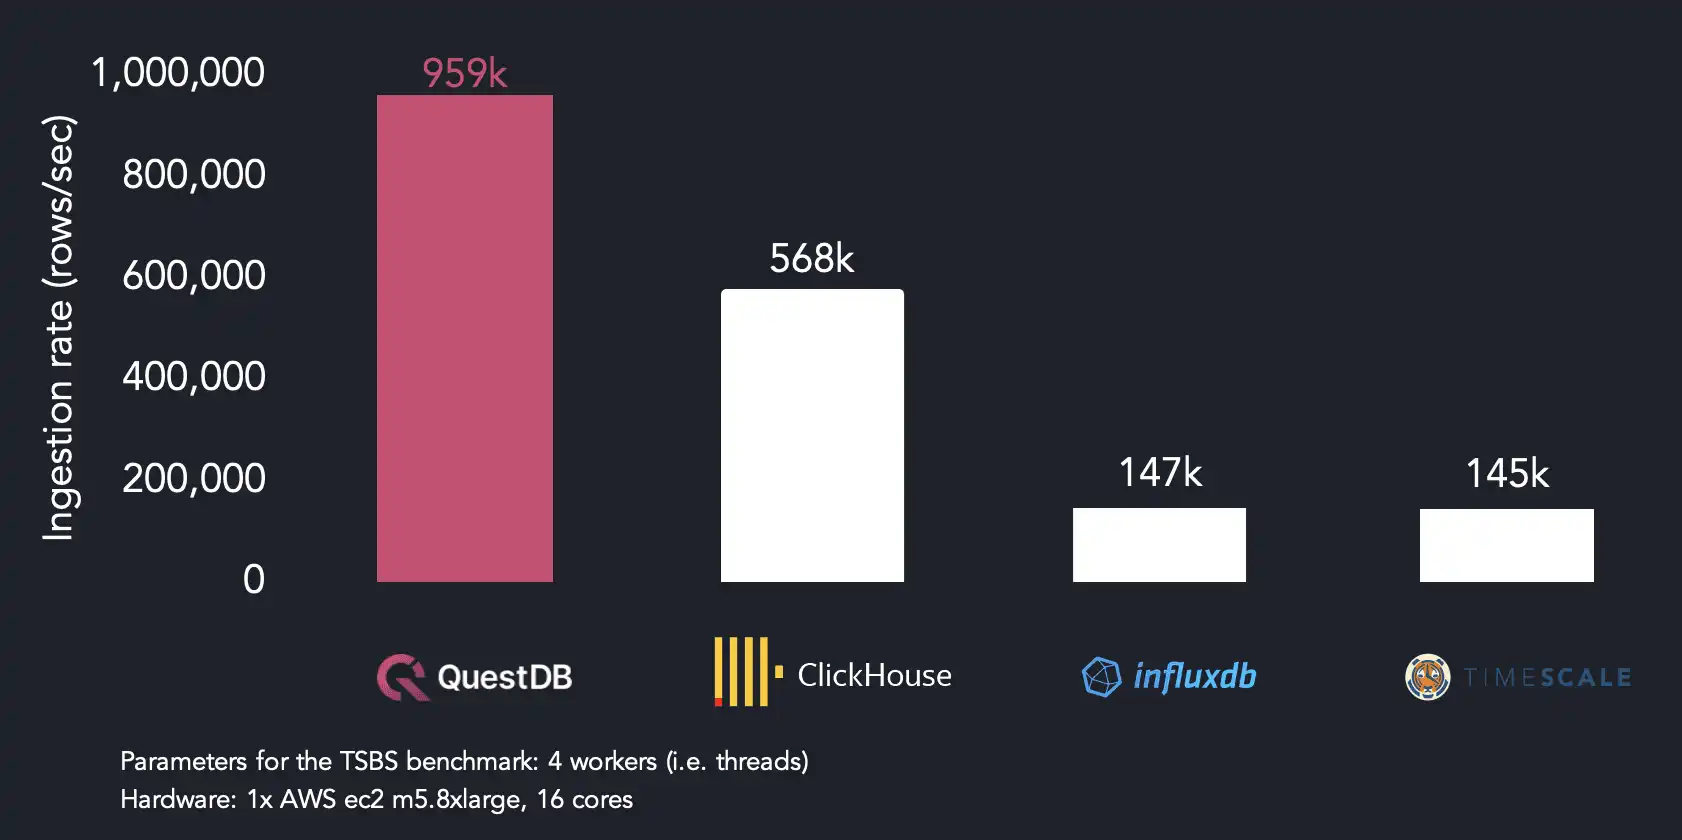
Because our ingestion format (ILP) repeats tag values per row, ClickHouse and TimescaleDB parse around two-thirds of the total volume of data as QuestDB does in the same benchmark run. We chose to stick with ILP because of its widespread use in time series, but we may use a more efficient format to improve ingestion performance in the future.
Measuring database performance with high-cardinality data
If we want to influence cardinality, we can use the scale flag of the
benchmark tool during data generation time:
tsbs_generate_data --scale=100 \
  --timestamp-start="2016-01-01T00:00:00Z" --timestamp-end="2016-01-15T00:00:00Z" \
  --use-case="cpu-only" --seed=123 --log-interval="10s" --format="influx"
The scale parameter provides a value for the number of unique devices we want
the test data set to contain. As the number of devices increases, so does the
number of unique identifiers values per data set, and we can control cardinality
directly. Here's some example output from the Time Series Benchmark Suite test
data with three different devices:
"hostname","region","datacenter","rack","os","arch","team","service","service_version","service_environment","usage_user","usage_system","usage_idle","usage_nice","usage_iowait","usage_irq","usage_softirq","usage_steal","usage_guest","usage_guest_nice","timestamp"
"host_0","eu-central-1","eu-central-1a","6","Ubuntu15.10","x86","SF","19","1","test",58,2,24,61,22,63,6,44,80,38,"2016-01-01T00:00:00.000000Z"
"host_1","us-west-1","us-west-1a","41","Ubuntu15.10","x64","NYC","9","1","staging",84,11,53,87,29,20,54,77,53,74,"2016-01-01T00:00:00.000000Z"
"host_2","sa-east-1","sa-east-1a","89","Ubuntu16.04LTS","x86","LON","13","0","staging",29,48,5,63,17,52,60,49,93,1,"2016-01-01T00:00:00.000000Z"
The table that we create on ingestion then stores tags as symbol types.
This symbol type is used to efficiently store repeating string values so that
similar records may be grouped together. Columns of this type are indexed so
that queries across tables by symbol are faster and more efficient to execute.
We tested each database with different scale values using 4, 6, and 16 threads on two different hosts which have the following specifications:
- AWS EC2 m5.8xlarge instance, Intel(R) Xeon(R) Platinum 8259CL CPU @ 2.50GHz
- AMD Ryzen 3970X 32-Core, GIGABYTE NVME HD
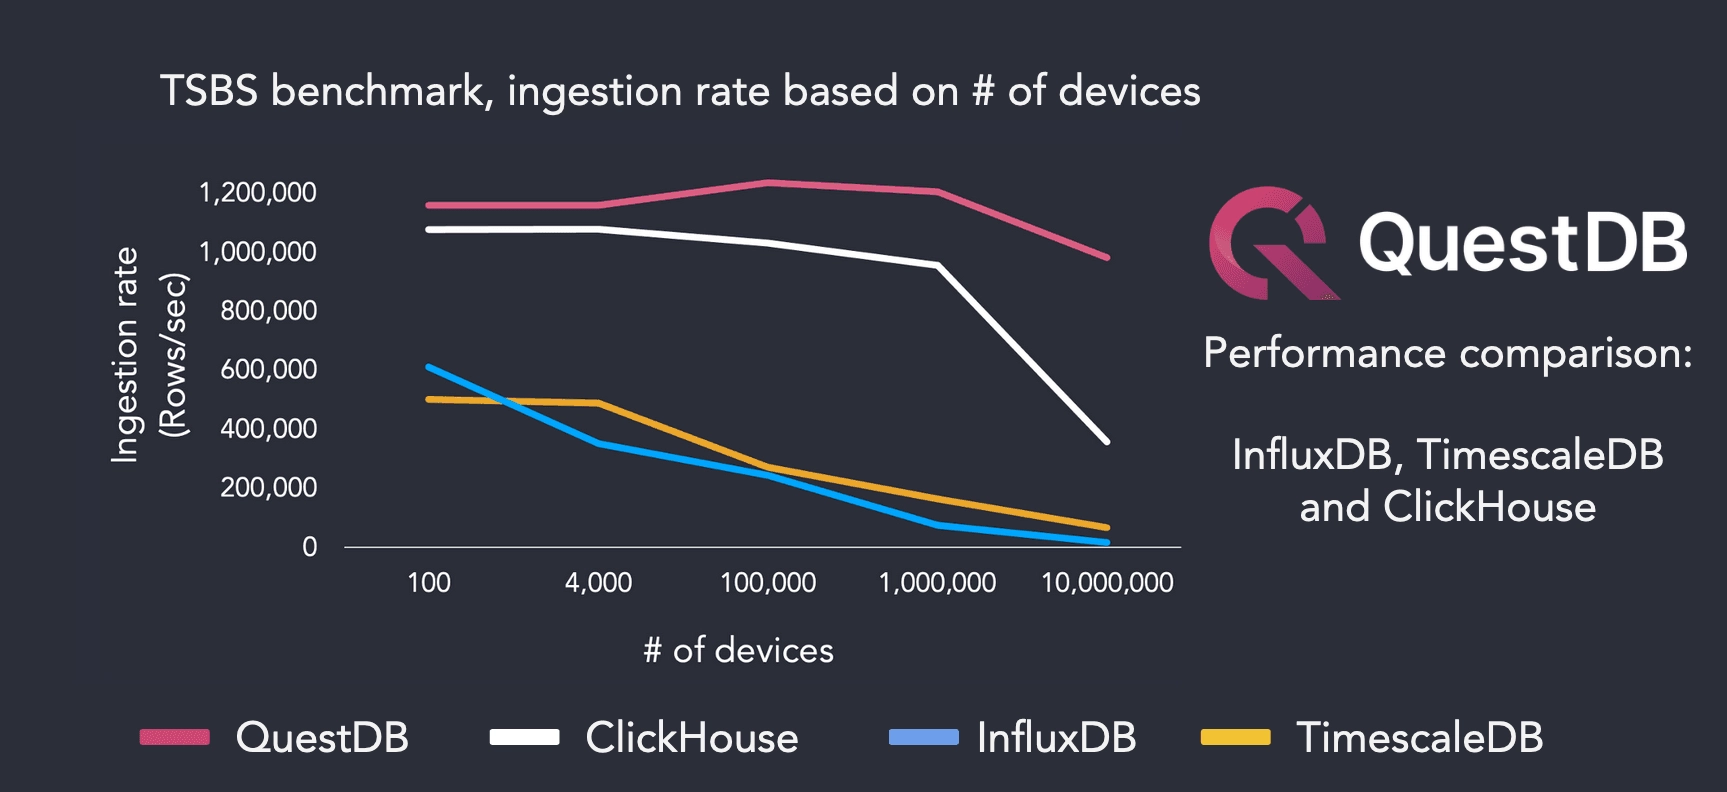
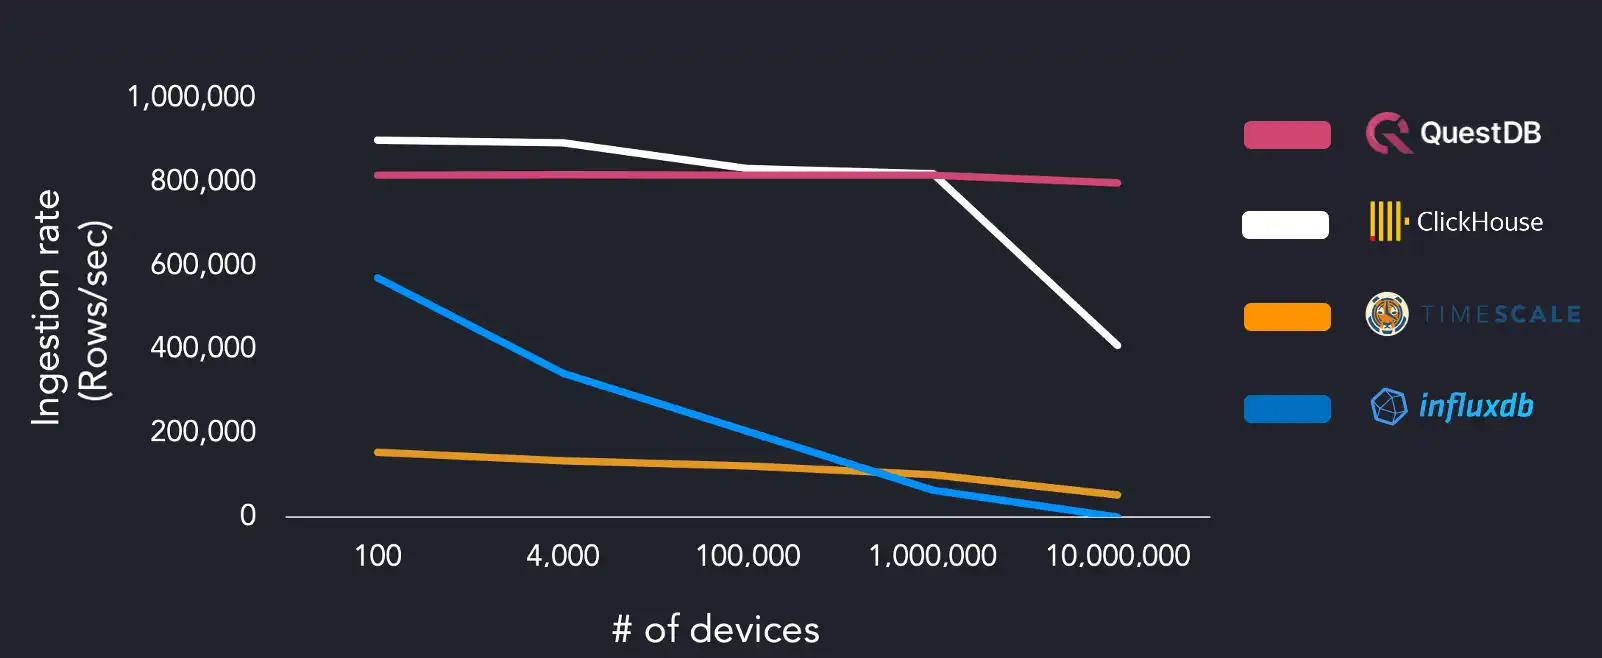
The following chart compares ingestion performance from lowest to highest cardinality running on the AWS EC2 instance with four threads:
Using a dataset with low cardinality of 100 devices, we hit maximum ingestion throughput of 904k rows/sec, with ClickHouse performing closest at 548k rows/sec. However, when increasing cardinality to 10 million devices, QuestDB sustains 640k rows/sec, and ClickHouse ingestion decreases at a similar rate relative to the device count with 345k rows/sec.
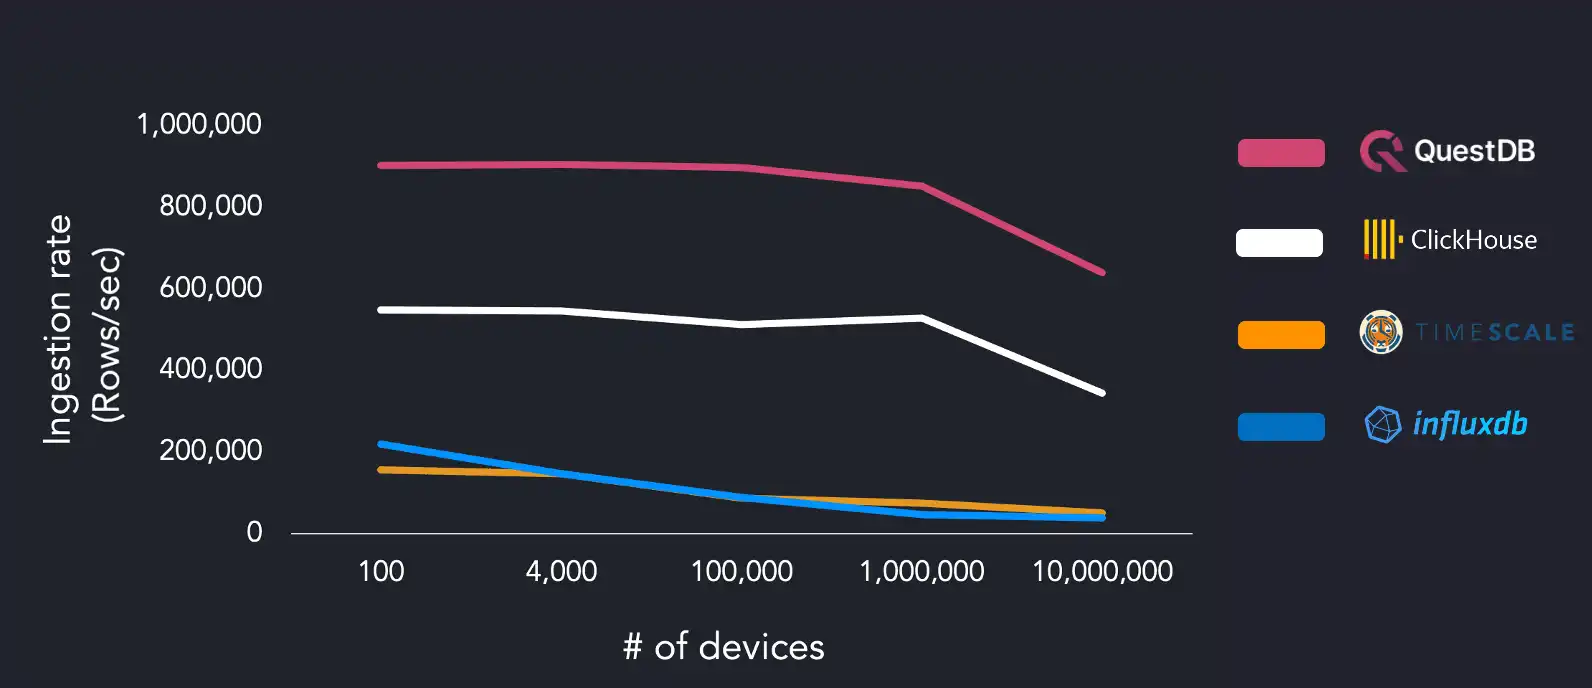
The other systems under test struggled with higher unique device count, with InfluxDB ingestion dropping to 38k rows/sec and TimescaleDB at 50k rows/sec with 10M devices. We reran the benchmark suite on the same AWS EC2 instance and increased the worker count (16 threads) to the systems under test:
QuestDB showed a mostly constant ingestion rate of 815k rows/sec with all degrees of cardinality. ClickHouse could ingest 900k rows/sec but requires four times as many workers as QuestDB to achieve this rate. ClickHouse ingestion drops to 409k rows/sec on the largest data set. There was no significant change in performance between four and sixteen workers for TimescaleDB. InfluxDB struggled the most, failing to finish successfully on the largest data set.
We ran the same benchmarks on a separate system using the AMD Ryzen 3970X, using 4, 6, and 16 threads to see if we could observe any changes in ingestion rates:
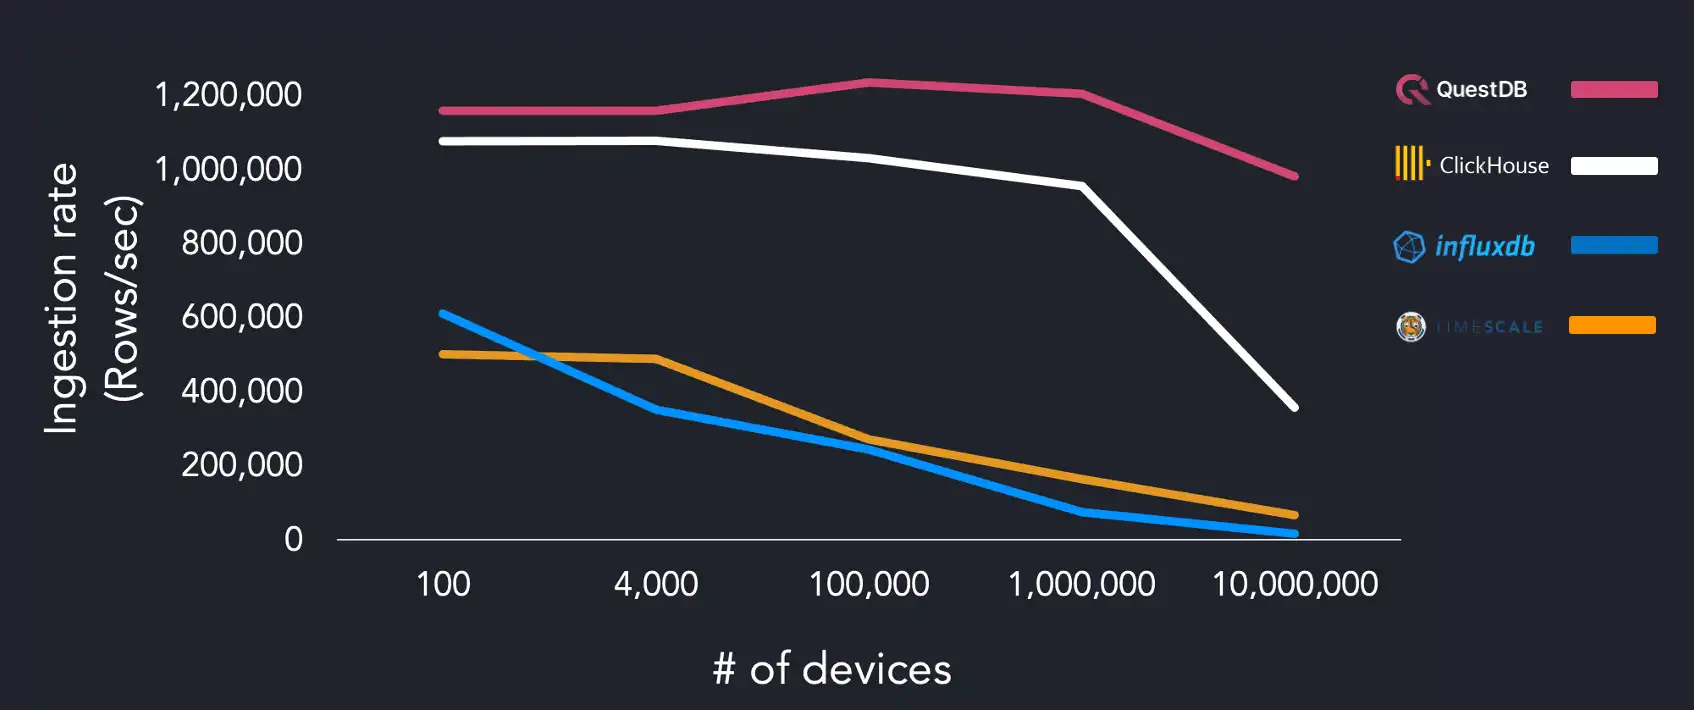
QuestDB hits maximum throughput with 1M devices during this run, with other systems performing better than on the AWS instance. We can assume that TimescaleDB is disk-bound as results change dramatically based on the difference between the tests run on the EC2 instance. QuestDB performance peaks when using four workers and slows down at 16 workers.
Why QuestDB can easily ingest time series data with high-cardinality
There are several reasons why QuestDB can quickly ingest data of this type; one factor is the data model that we use to store and index data. High-cardinality data has not been a pain point for our users due to our choices when designing the system architecture from day one. This storage model was chosen for architectural simplicity and quick read and write operations.
When we are ingesting InfluxDB line protocol, the message 'tags' are stored as symbol types. This symbol type is used to efficiently store repeating string values so that similar records may be grouped together. Columns of this type are indexed so that queries across tables by symbol are faster and more efficient to execute. In addition, we massively parallelize hashmap operations on indexed columns and use SIMD to do a lot of heavy lifting across the entire SQL engine so we can execute procedures relating to indexes and hashmap lookup in parallel where possible.
Contributing to the Time Series Benchmark Suite
We have opened a pull request (#157 - Questdb benchmark support) in TimescaleDB's TSBS GitHub repository which adds the ability to run the benchmark against QuestDB. In the meantime, readers may clone our fork of the benchmark suite and run the tests to see the results for themselves.
We're happy to provide compatibility with the Time Series Benchmark Suite, which is a reproducible way to compare query and ingestion performance across multiple systems. With this compatibility, we hope to make it easier to assess which time series database is the proper tool for a particular use case.
If you would like to know more about QuestDB and how it can solve problems that arise when dealing with large amounts of time series data, feel free to join our Community Forum or view our enterprise page for an overview of the solutions we offer.