If you're working with large amounts of data, you've likely heard about high-cardinality or ran into issues relating to it. It might sound like an intimidating topic if you're unfamiliar with it, but this article explains what cardinality is and why it crops up often with databases of all types. IoT and monitoring are use cases where high-cardinality is more likely to be a concern. Still, a solid understanding of this concept helps when planning general-purpose database schemas and understanding common factors that can influence database performance.
What is high-cardinality data?
Cardinality typically refers to the number of elements in a set's size. In the context of a time series database (TSDB), rows will usually have columns that categorize the data and act like tags. Assume you have 1000 IoT devices in 20 locations, they're running one of 5 firmware versions, and report input from 5 types of sensor per device. The cardinality of this set is 500,000 (1000 x 20 x 5 x 5). This can quickly get unmanageable in some cases, as even adding and tracking a new firmware version for the devices would increase the set to 600,000 (1000 x 20 x 6 x 5).
In these scenarios, experience shows that we will want to eventually get insights on more kinds of information about the devices, such as application errors, device state, metadata, configuration and so on. With each new tag or category we add to our data set, cardinality grows exponentially. In a database, high-cardinality boils down to the following two conditions:
- a table has many indexed columns
- each indexed column contains many unique values
How can I measure database performance using high-cardinality data?
A popular way of measuring the throughput of time series databases is to use the Time Series Benchmark Suite, a collection of Go programs that generate metrics from multiple simulated systems. For measuring the performance of QuestDB, we create data in InfluxDB line protocol format, which consists of ten 'tags' and ten 'measurements' per row.
tsbs_generate_data --scale=100 \
  --timestamp-start="2016-01-01T00:00:00Z" --timestamp-end="2016-01-15T00:00:00Z" \
  --use-case="cpu-only" --seed=123 --log-interval="10s" --format="influx"
If we want to influence cardinality, we can use the scale flag, which provides
a value for the number of unique devices we want the test data set to contain.
As the number of devices increases, so does the number of unique identifiers
values per data set, and we can control cardinality directly. Here's some
example output from the Time Series Benchmark Suite test data with three
different devices:
"hostname","region","datacenter","rack","os","arch","team","service","service_version","service_environment","usage_user","usage_system","usage_idle","usage_nice","usage_iowait","usage_irq","usage_softirq","usage_steal","usage_guest","usage_guest_nice","timestamp"
"host_0","eu-central-1","eu-central-1a","6","Ubuntu15.10","x86","SF","19","1","test",58,2,24,61,22,63,6,44,80,38,"2016-01-01T00:00:00.000000Z"
"host_1","us-west-1","us-west-1a","41","Ubuntu15.10","x64","NYC","9","1","staging",84,11,53,87,29,20,54,77,53,74,"2016-01-01T00:00:00.000000Z"
"host_2","sa-east-1","sa-east-1a","89","Ubuntu16.04LTS","x86","LON","13","0","staging",29,48,5,63,17,52,60,49,93,1,"2016-01-01T00:00:00.000000Z"
The table that we create on ingestion then stores tags as symbol types.
This symbol type is used to efficiently store repeating string values so that
similar records may be grouped together. Columns of this type are indexed so
that queries across tables by symbol are faster and more efficient to execute.
The unique values per symbol column in the benchmark test data are:
- hostname =
scale_val - region = 3
- datacenter = 3
- rack = 3
- os = 2
- arch = 2
- team = 3
- service = 3
- service_version = 2
- service_environment = 2
This means we can calculate the cardinality of our test data as:
scale_val x 3 x 3 x 3 x 2 x 2 x 3 x 3 x 2 x 2
# or
scale_val x 3888
Exploring high-cardinality in a time series database benchmark
When we released QuestDB version 6.0, we included benchmark results that tested the performance of our new ingestion subsystem, but we didn't touch on the subject of cardinality at all. We wanted to explore this topic in more detail to see how QuestDB can handle different degrees of cardinality. We also thought this would be interesting to share with readers as high-cardinality is a well-known topic for developers and users of databases.
The tests we ran for our previous benchmarks all used a scale of 4000, meaning we had a cardinality of 15,552,000 for all systems. For this benchmark, we created multiple data sets with the following scale and the resulting cardinality:
| scale | cardinality |
|---|---|
100 | 388,800 |
4000 | 15,552,000 |
100000 | 388,800,000 |
1000000 | 3,888,000,000 |
10000000 | 38,880,000,000 |
We also wanted to see what happens when we rerun the tests and provide more threads (workers) to each system to observe how a database scales with cardinality based on how much work it can perform in parallel. For that reason, we tested each database with the scale values the table above using 4, 6, and 16 threads on two different hosts which have the following specifications:
- AWS EC2 m5.8xlarge instance, Intel(R) Xeon(R) Platinum 8259CL CPU @ 2.50GHz
- AMD Ryzen 3970X 32-Core, GIGABYTE NVME HD
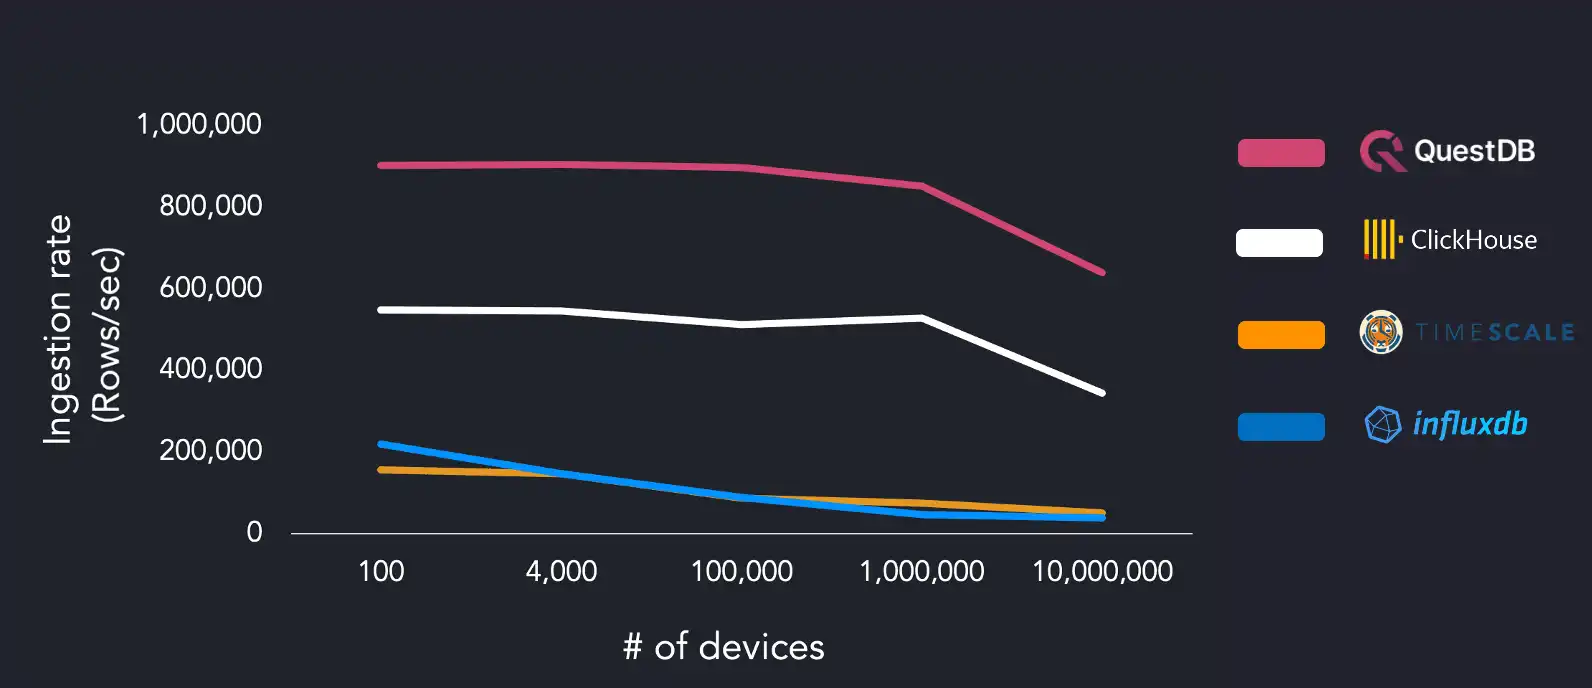
The following chart compares ingestion performance from lowest to highest cardinality running on the AWS EC2 instance with four threads:

Using a dataset with low cardinality of 100 devices, we hit maximum ingestion throughput of 904k rows/sec, with ClickHouse performing closest at 548k rows/sec. However, when increasing cardinality to 10 million devices, QuestDB sustains 640k rows/sec, and ClickHouse ingestion decreases at a similar rate relative to the device count with 345k rows/sec.
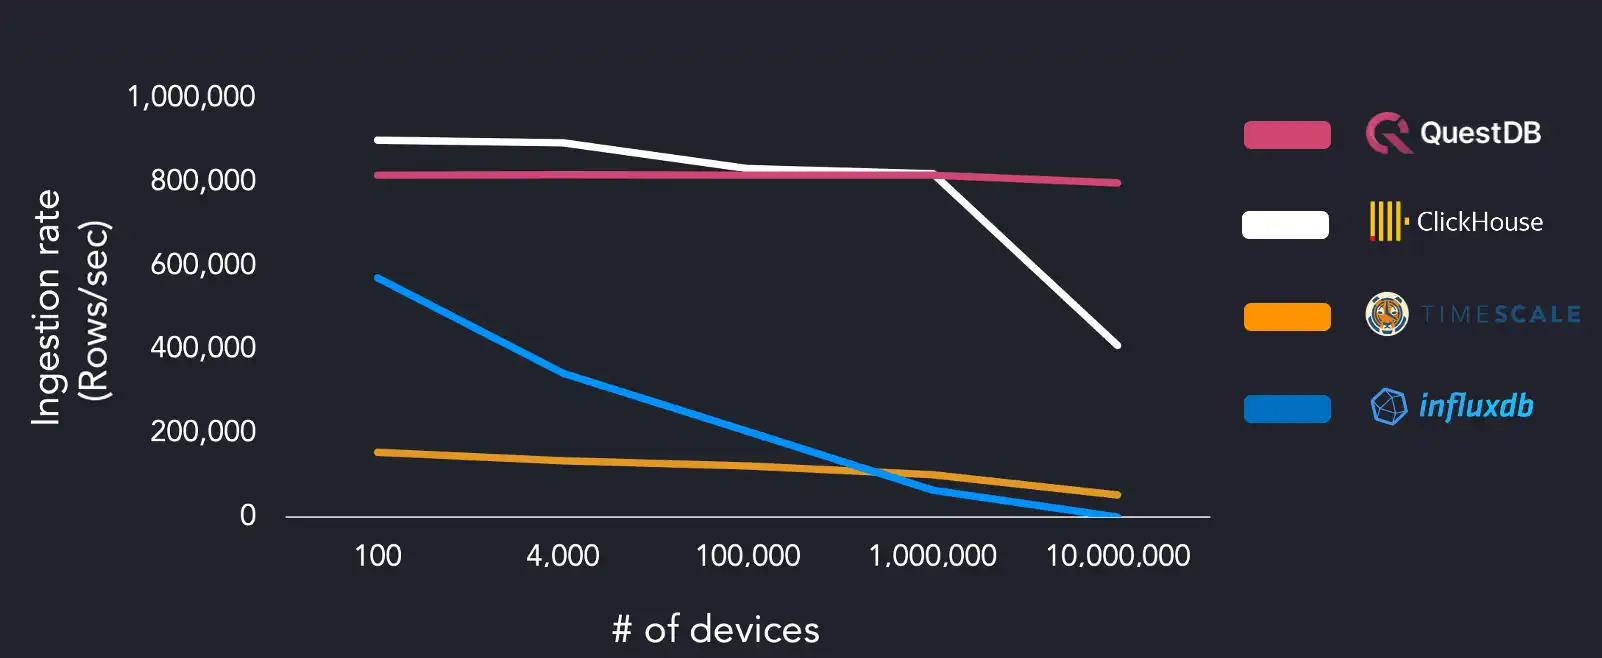
The other systems under test struggled with higher unique device count, with InfluxDB ingestion dropping to 38k rows/sec and TimescaleDB at 50k rows/sec with 10M devices. We reran the benchmark suite on the same AWS EC2 instance and increased the worker count (16 threads) to the systems under test:

QuestDB showed a mostly constant ingestion rate of 815k rows/sec with all degrees of cardinality. ClickHouse could ingest 900k rows/sec but requires four times as many workers as QuestDB to achieve this rate. ClickHouse ingestion drops to 409k rows/sec on the largest data set. There was no significant change in performance between four and sixteen workers for TimescaleDB. InfluxDB struggled the most, failing to finish successfully on the largest data set.
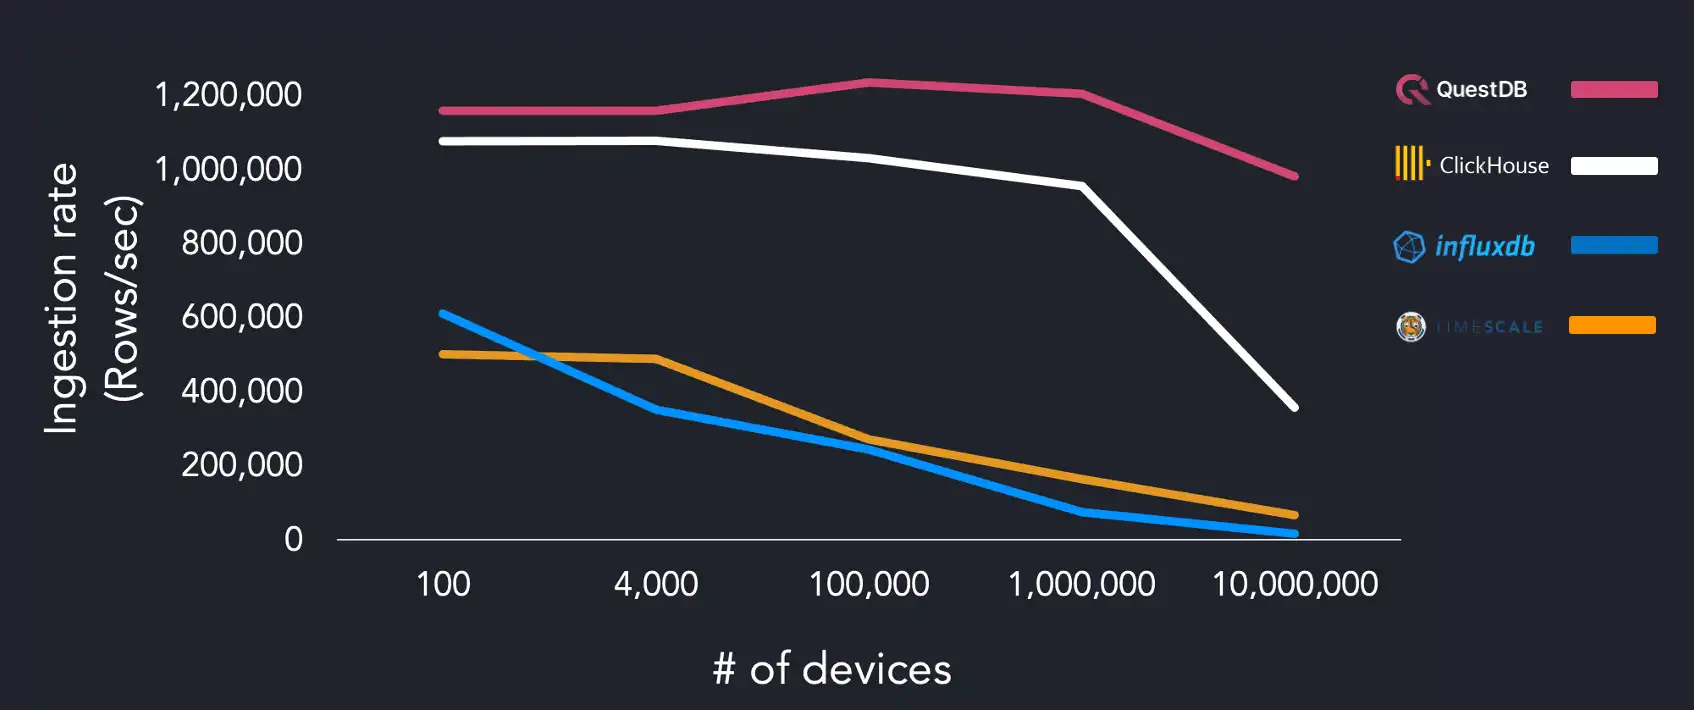
We ran the same benchmarks on a separate system using the AMD Ryzen 3970X, using 4, 6, and 16 threads to see if we could observe any changes in ingestion rates:

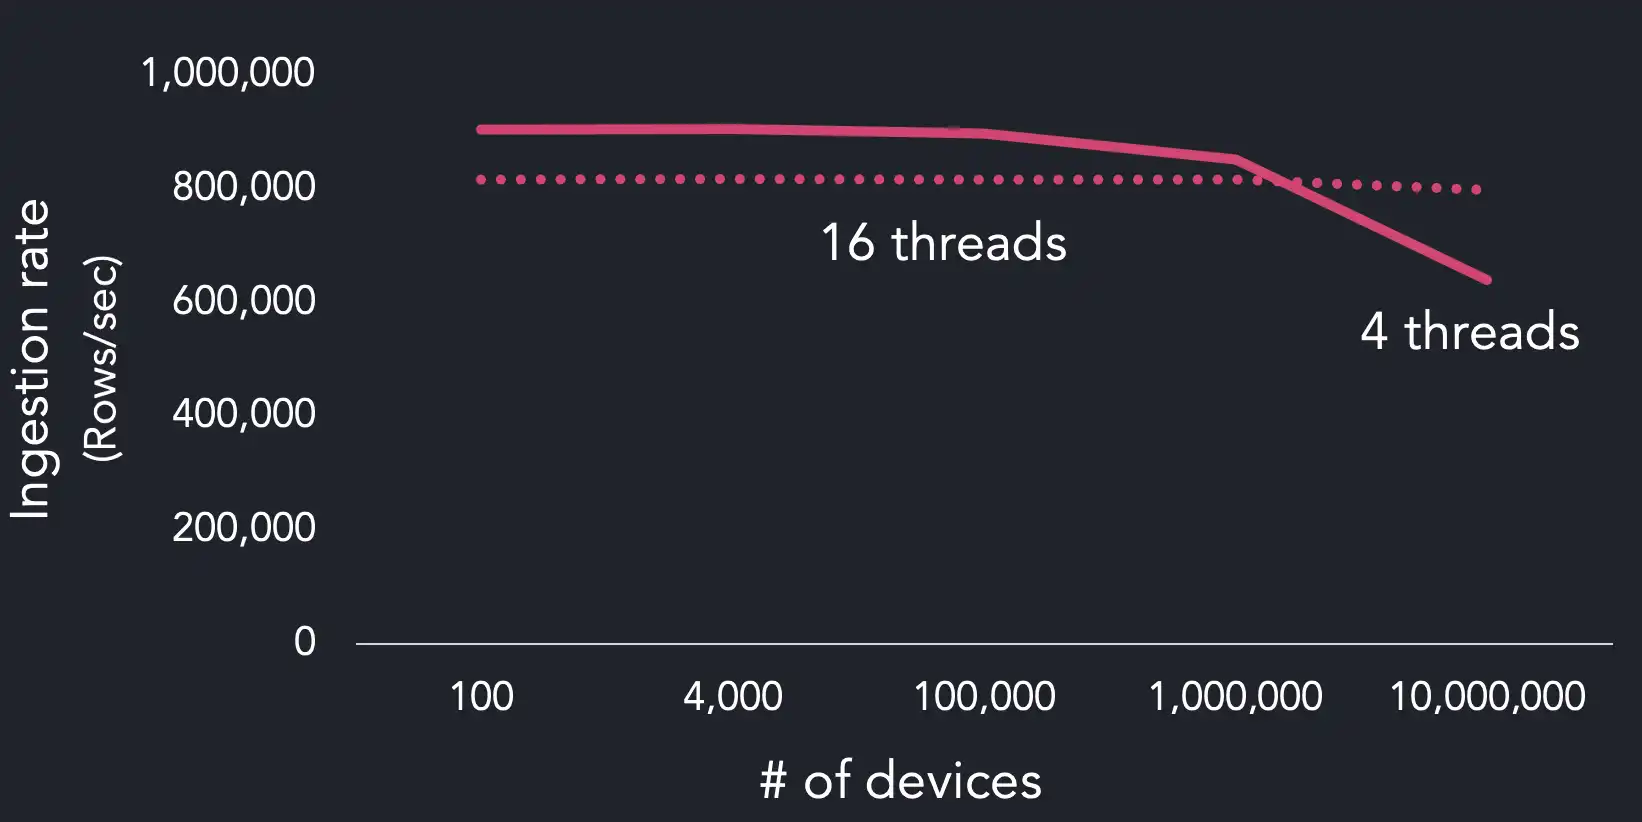
QuestDB hits maximum throughput with 1M devices during this run, with other systems performing better than on the AWS instance. We can assume that TimescaleDB is disk-bound as results change dramatically based on the difference between the tests run on the EC2 instance. QuestDB performance peaks when using four workers and slows down at 16 workers.
One key observation is that QuestDB handles high-cardinality better with more threads. Conversely, when cardinality is low, fewer workers lead to an overall higher maximum throughput and a steeper drop in ingestion rates when going from 1M devices to 10M. The reason for lower maximum throughput when adding more workers is due to increased thread contention:

Why QuestDB can easily ingest time series data with high-cardinality
There are several reasons why QuestDB can quickly ingest data of this type; one factor is the data model that we use to store and index data. High-cardinality data has not been a pain point for our users due to our choices when designing the system architecture from day one. This storage model was chosen for architectural simplicity and quick read and write operations.
The main reason why QuestDB can handle high-cardinality data is that we massively parallelize hashmap operations on indexed columns. In addition, we use SIMD to do a lot of heavy lifting across the entire SQL engine, which means that we can execute procedures relating to indexes and hashmap lookup in parallel where possible.
Users who have migrated from other time-series databases told us that degraded performance from high-cardinality data manifests with most systems early, but their threshold for usability is about 300K. After running the benchmark with high-cardinality, we were pleased with our system stability with up to 10 million devices without a significant performance drop.
Configuring parameters to optimize ingestion on high-cardinality data
The ingestion subsystem that we shipped in version 6.0 introduces parameters that users may configure server-wide or specific to a table. These parameters specify how long to keep incoming data in memory and how often to merge and commit incoming data to disk. The two parameters that are relevant for high-cardinality data ingestion are commit lag and the maximum uncommitted rows.
Lag refers to the expected maximum lateness of incoming data relative to the newest timestamp value. When records arrive at the database with timestamp values out-of-order by the value specified in the commit lag, sort and merge commits are executed. Additionally, the maximum uncommitted rows can be set on a table which is a threshold for the maximum number of rows to keep in memory before sorting and committing data. The benefit of these parameters is we can minimize the frequency of commits depending on the characteristics of the incoming data:
alter table cpu set param commitLag=50us;
alter table cpu set param maxUncommittedRows=10000000;
If we take a look at the type of data that we are generating in the Time Series
Benchmark Suite, we can see that for 10M devices, the duration of the data set
is relatively short (defined by the timestamp --timestamp-start and
--timestamp-end flags):
tsbs_generate_data --scale=10000000 \
  --timestamp-start="2016-01-01T00:00:00Z" --timestamp-end="2016-01-01T0:00:36Z"
  --log-interval="10s" --format="influx" \
  --use-case="cpu-only" --seed=123 > /tmp/cpu-10000000
This command generates a data set of 36M rows and spans only 36 seconds of simulated activity. With throughput at this degree, the commit lag can be a much smaller value, such as 50 or 100 microseconds, and the maximum uncommitted rows can be around 10M. The explanation behind these values is that we expect a much narrower band of the lateness of records in terms of out-of-order data, and we have an upper-bounds of 10M records in memory before a commit occurs.
Planning the schema of a table for high-cardinality data can also have a significant performance impact. For example, when creating a table, we can designate resources for indexed columns to know how many unique values the symbol column will contain, and done via capacity as follows:
create table cpu (
  hostname symbol capacity 20000000,
  region symbol,
  ...
) timestamp(timestamp) partition by DAY;
In this case, we're setting a capacity of 20M for the hostname column, which
we know will contain 10M values. It's generally a good idea to specify the
capacity of an indexed column at about twice the expected unique values if the
data are out-of-order. High RAM usage is associated with using a large capacity
on indexed symbols with high-cardinality data as these values sit on the memory
heap.
Next up
This article shows how high-cardinality can quickly emerge in time series data in industrial IoT, monitoring, application data and many other scenarios. If you have have feedback or questions about this article, feel free ask in our Community Forum or browse the project on GitHub where we welcome contributions of all kinds.