As I was browsing my timeline on the boring afternoon of the New Year's Day 2024, this tweet by Gunnar Morling jumped out:
How fast can YOU aggregate 1B rows using modern #Java? Grab your threads, flex your SIMD, and kick off 2024 true coder style by joining this friendly little competition. Submissions accepted until Jan 31.
The challenge was this:
Write a Java program for retrieving temperature measurement values from a text file and calculating the min, mean, and max temperature per weather station. There’s just one caveat: the file has 1,000,000,000 rows!
My first thought was, "Pfft, min, mean and max, that's so simple!" And the dataset was simple as well: just 413 unique keys, of quite uniform, short lengths. Super-simple data format. A whole month to do it. Where's the challenge?? As is often the case, the devil was in the details.
It soon dawned on the contestants that calculating only min, mean and max made the competition harder, not easier. But why? There wasn't one obvious place consuming CPU cycles. Opportunities to make it even faster lay everywhere, even in the darkest corners of the CPU architecture.
As a saving grace, the challenge was held out in the open on GitHub. Copying others' ideas wasn't just allowed, it was encouraged. This was to be a learning experience, not a war of secrets.
It was also going to be a month-long frenzy of research, ingenuity, and just plain fun. It grabbed the attention and devotion of hundreds of enthusiasts, including at least a dozen or two top Java performance experts.
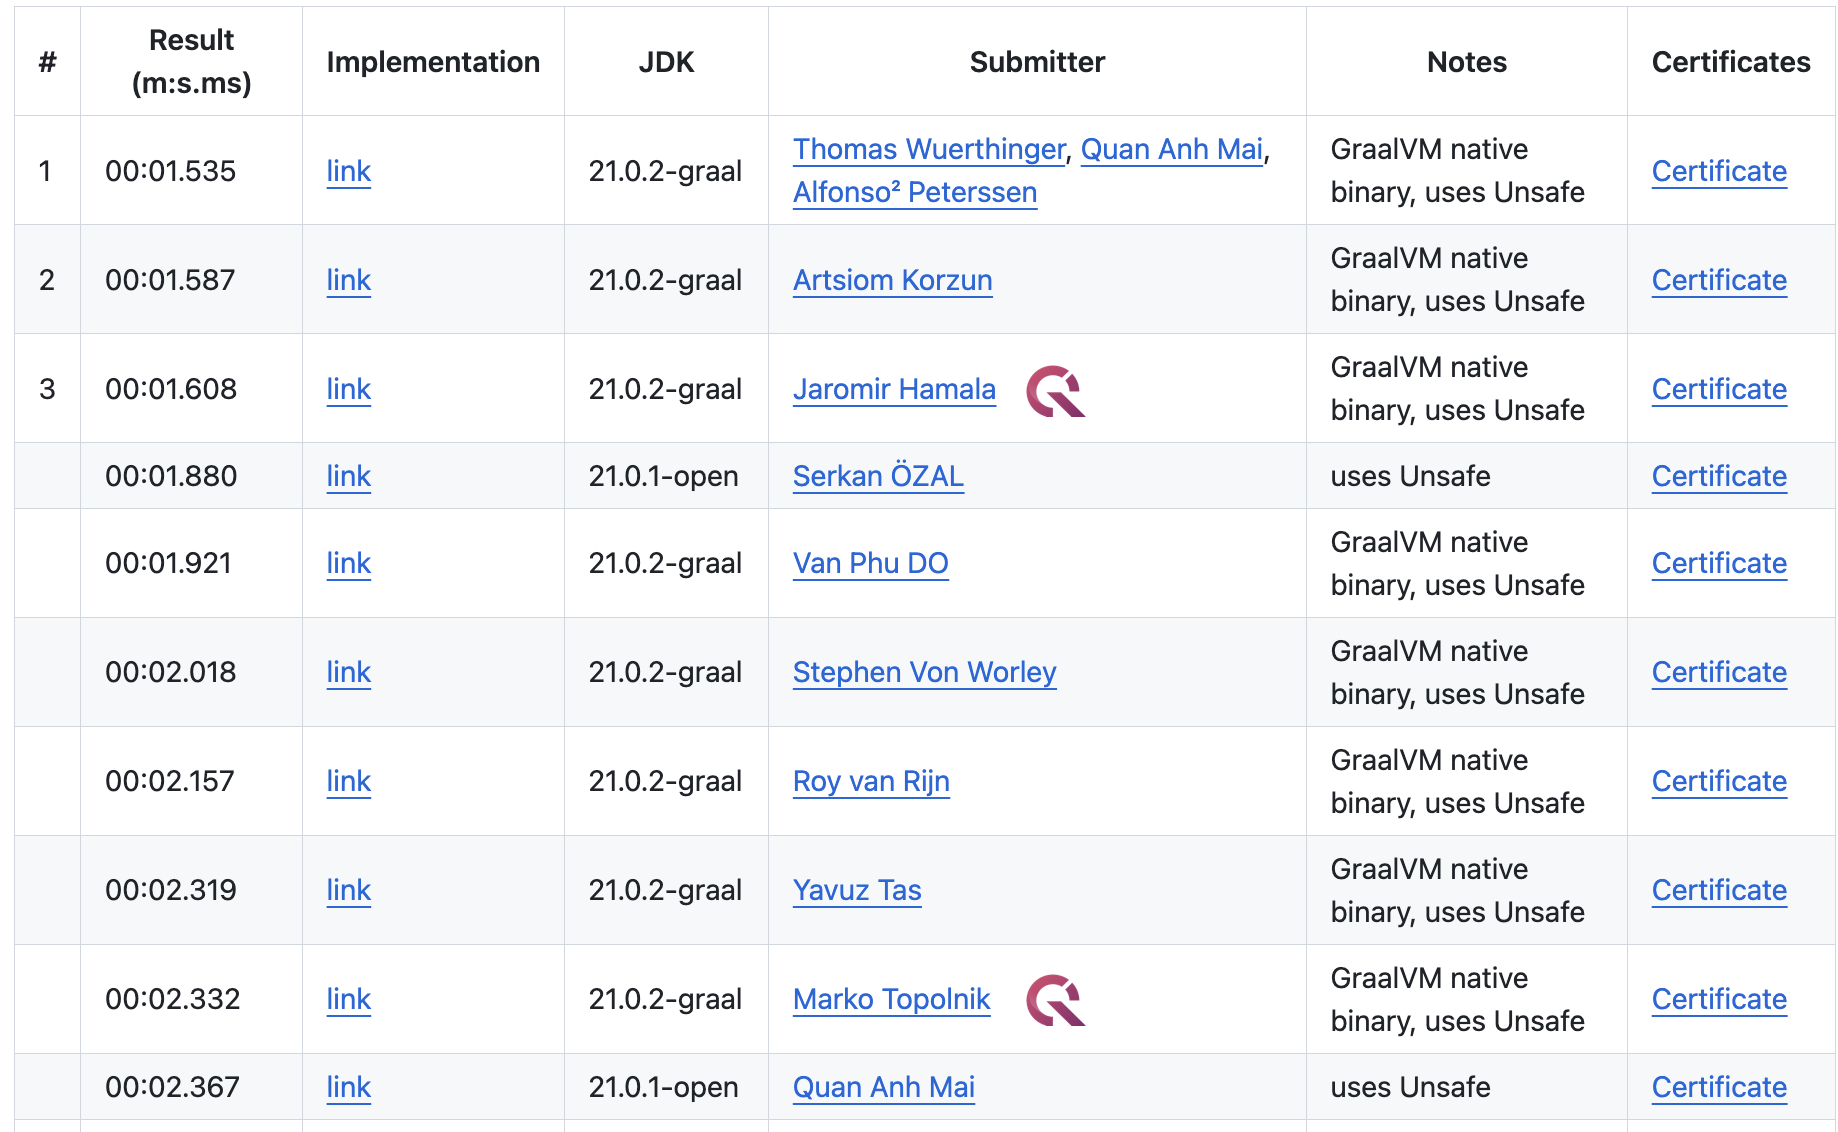
The winning solution is the one submitted by none other than Thomas Wuerthinger (@thomaswue), the lead of the GraalVM project — that's the kind of heavyweights I'm talking about! Along with several other key contestants, he introduced many of the great ideas that everyone else grabbed and incorporated into their own submissions.
My submission did quite well, ending up at spot #9. My QuestDB colleague, Jaromir Hamala (@jerrinot), fared even better, placing 3rd — just 73 milliseconds behind the winner!
What came out on top
Now that you read the rules, can you guess what's the actual challenge? Can you visualize what the winning code would look like? Here, have a look!
For that matter, look at any of the top 10 solutions, including mine, and especially at the hot loop in each of them — the part of the code where the program spends almost all of its time.
If you ever had the experience of writing a small program in C++ or Rust, and then looking at the optimized machine code the compiler produced, you'll get similar vibes here. Abstractions are spilled open, concerns are criss-crossing and interleaving each other. A ton of utterly alien-looking, bit-twiddling logic.
How could a human programmer possibly get to this point? Like in so many other cases, it was people working together and improving step by step. Dozens of Java experts iterated through many tricks and hacks, and as January rolled on, the processing time kept dropping lower and lower.
The main thing I'd like to show you in this post is that a good part of that amazing speed comes from easy-to-grasp, reusable tricks that you could apply in your code as well. Towards the end, I'll also show you some of the magical parts that take it beyond that level.
The "normal" implementation
OK: 1,000,000,000 rows - here we go!
For context, this is a sample of the temperature input file. Each line contains a station name and a temperature reading:
Hamburg;12.0
Bulawayo;8.9
Palembang;38.8
St. John's;15.2
Cracow;-12.6
And this is the expected output:
{Abha=-23.0/18.0/59.2, Abidjan=-16.2/26.0/67.3, Abéché=-10.0/29.4/69.0, ...}
As a first take, let's apply some idiomatic Java code that would pass muster with any seasoned Java developer:
var allStats = new BufferedReader(new FileReader("measurements.txt"))
        .lines()
        .parallel()
        .collect(
                groupingBy(line -> line.substring(0, line.indexOf(';')),
                summarizingDouble(line ->
                        parseDouble(line.substring(line.indexOf(';') + 1)))));
var result = allStats.entrySet().stream().collect(Collectors.toMap(
        Entry::getKey,
        e -> {
            var stats = e.getValue();
            return String.format("%.1f/%.1f/%.1f",
                    stats.getMin(), stats.getAverage(), stats.getMax());
        },
        (l, r) -> r,
        TreeMap::new));
System.out.println(result);
This code:
- uses parallel Java streams, which put all the CPU cores to work
- doesn't fall into any known performance traps like Java regex
- leans heavily into all the great building blocks provided by the JDK
On a Hetzner CCX33 instance with OpenJDK 21.0.2, it takes 71 seconds to complete. But the best solution takes 1.5 seconds — that's a jaw-dropping 47 times faster! As we said, the way to get there is step by step, so let's start with the first one.
Optimization 0: Choose a good VM
Before we touch the code, there's a low effort way to speed up your program: use a modernized JVM. Many production deployments still run on Java 8 or 11, but the pace of progress since those days has been significant.
During the 1BRC challenge, we found that GraalVM is one damn fast JVM. It also supports compiling into a native binary, which eliminates the JVM startup cost.
By simply downloading GraalVM and making it the default, my solution improved from 71 seconds to 66 — a solid 7.5% improvement for very little effort.
When we get deeper into optimizing and bring down the runtime to 2-3 seconds, eliminating the JVM startup provides another 150-200ms in relief. That becomes a big deal.
First profile, then optimize
Every successful 1BRC contestant used profiling of one kind or another to guide their optimization efforts. I used a combination of three tools:
- Good old VisualVM
- Async Profiler
perfcommand-line tool
Many people consider VisualVM outdated, but it harbors a hidden gem: The VisualGC plugin. You have to install it from the Tools→Plugins menu. Once you attach it to a running Java program, VisualGC shows up as the rightmost tab in the window.
Be sure to select the shortest refresh period (100 ms), and then enjoy the show.
A realtime animation of all the memory regions the garbage collector maintains,
along with a graph of JIT compilations and GC runs will appear. I used to spend
hours staring at this oddly satisfying, complex dance of GC's cogwheels. For the
1BRC program, I added a while (true) statement to keep processing the input
file forever; otherwise things just flash by.
The Async Profiler came from following Gunnar's advice on the
1BRC GitHub page.
The jbang tool provides very convenient access to it. You run the program
once, and get an HTML file with a flamegraph. The flamegraph then tells you
which functions/methods your program is spending the most time in.
The third tool, perf, has many features, but for Java the most popular choice
is perf stat. It doesn't analyze any specific method, but gives you insight
into low-level CPU counters. It shows:
- How many instructions it executed
- How many branches and memory accesses
- How many of those were branch/L1 cache misses.
To receive these insights, I used the following command:
perf stat -e branches,branch-misses,cache-references,cache-misses,cycles,instructions,idle-cycles-backend,idle-cycles-frontend,task-clock -- java --enable-preview -cp src Blog1
VisualGC was the most useful in the initial optimization phase. Then, once I
sorted out allocation, the flamegraph proved highly useful to pinpoint the
bottlenecks in the code. However, once the runtime went below ~3 seconds, its
usefulness declined. At this level we're squeezing out performance not from
methods, but from individual CPU instructions. This is where perf stat became
the best tool.
For reference, here's the perf stat report for our basic implementation:
   393,418,510,508      branches
     3,112,052,890      branch-misses
    26,847,457,554      cache-references
       982,409,158      cache-misses
   756,818,510,991      cycles
 2,031,528,945,161      instructions
It's most helpful to interpret the numbers on a per-row basis (dividing everything by 1 billion). We can see that the program spends more than 2,000 instructions on each row. No need to get into more details; initially we'll be driving down just this metric.
Optimization 1: Parallelize I/O
A quick profiling run with VisualVM and flamegraph reveals no clear bottleneck for our initial Streams API code.
Note: Scroll down the flamegraph page to see the graph!
The time divides roughly equally among three main tasks:
BufferedReaderwork that outputs a string for each line- Processing these lines
- Garbage collection (GC)
VisualVM shows GC cycles running like crazy, 10 times per second or more. What's worse, there's some spilling to the Old generation, triggering background GC runs as well. We have to decide what to attack first.
The first thing most of us at the challenge realized was that we have to parallelize the I/O. In the above code, a single thread does all the file reading and emits a stream of lines. This includes finding the newline and allocating a string for each line. On the other hand, the entire input file fits into the disk cache. It's a great target for parallelization.
One tried-and-true approach is to split the file into as many chunks as there are threads, and process each chunk independently. Unfortunately, in order to take that step, we have to say goodbye to the concise Streams API and do everything by hand.
We could read the chunks using the API of RandomAccessFile, but since it
doesn't natively support buffered reading, it would be a quirky implementation
that would involve copying from the native memory to the Java buffer.
Instead, everyone went for the mmap approach. This meant that you would work
with the file as if it was a large in-memory array. Java has supported mmap
for a long time, relying on the ByteBuffer API to read the native memory. It
uses int for indexing, limiting the mapped region size to 2 GB.
The JDK team is currently introducing a newer API based on long indexing,
MemorySegment. In the spirit of 1BRC, which encourages using the latest and
greatest Java features, let's go with that:
var raf = new RandomAccessFile(file, "r");
MemorySegment mappedFile = raf.getChannel().map(
    MapMode.READ_ONLY, 0, length, Arena.global()
);
There are some finicky details involved in finding the exact place to split the files, launch threads, wait on them, and so on. Tending to these details sees our code explode from the initial 17 lines to 120. You can review it here (for now we're using the commented-out "Variant 1" at line 84).
Let's focus on a few key snippets.
First, the hot loop now looks like this:
for (var cursor = 0L; cursor < chunk.byteSize();) {
    var semicolonPos = findByte(cursor, ';');
    var newlinePos = findByte(semicolonPos + 1, '\n');
    var name = stringAt(cursor, semicolonPos);
    var temp = Double.parseDouble(stringAt(semicolonPos + 1, newlinePos));
    var stats = statsMap.computeIfAbsent(name, k -> new StationStats(name));
    var intTemp = (int) Math.round(10 * temp);
    stats.sum += intTemp;
    stats.count++;
    stats.min = Math.min(stats.min, intTemp);
    stats.max = Math.max(stats.max, intTemp);
    cursor = newlinePos + 1;
}
With the Streams API and BufferedReader gone, we run a hand-coded function,
findByte(), to find the separator characters. This avoids creating a string
for the whole line, but still creates strings for the name and the temperature,
using the method named stringAt(). Here are these two methods:
private long findByte(long cursor, int b) {
    for (var i = cursor; i < chunk.byteSize(); i++) {
        if (chunk.get(JAVA_BYTE, i) == b) {
            return i;
        }
    }
    throw new RuntimeException(((char) b) + " not found");
}

private String stringAt(long start, long limit) {
    return new String(
            chunk.asSlice(start, limit - start).toArray(JAVA_BYTE),
            StandardCharsets.UTF_8
    );
}
We also added code to collect the partial results from all the threads and merge them. All put together, this brings the processing time down by a whopping 4x, from 66 to 17 seconds!
On any other day, you may congratulate your expert self on this achievement. But in the 1BRC, we were just getting started.
Let's see the perf stat report on this code:
   229,112,005,628      branches
     2,159,757,411      branch-misses
    11,691,731,241      cache-references
       433,992,993      cache-misses
   408,367,307,956      cycles
   944,615,442,392      instructions
We halved the number of instructions per row to 945.
Another flamegraph reveals that GC time has almost disappeared. But in VisualVM, we can see there's still a lot of minor GC runs, although they use much less CPU because there's no more promotion to the Old generation.
The CPU is now spending most of its time in stringAt, primarily in string
creation and in copying the data from native memory into a heap-allocated
byte[]. Significant time is also spent in Map.computeIfAbsent(),
Double.parseDouble(), and findByte().
Let's attack temperature parsing first.
Optimization 2: Directly parse temperature as int
We can improve temperature parsing a lot. As it is, first we allocate a
String, then call parseDouble() on it, and then convert to int for
efficient storage and calculation. Instead, we should directly create the
integer:
private int parseTemperature(long semicolonPos) {
    long off = semicolonPos + 1;
    int sign = 1;
    byte b = chunk.get(JAVA_BYTE, off++);
    if (b == '-') {
        sign = -1;
        b = chunk.get(JAVA_BYTE, off++);
    }
    int temp = b - '0';
    b = chunk.get(JAVA_BYTE, off++);
    if (b != '.') {
        temp = 10 * temp + b - '0';
        // we found two integer digits. The next char is definitely '.', skip it:
        off++;
    }
    b = chunk.get(JAVA_BYTE, off);
    temp = 10 * temp + b - '0';
    return sign * temp;
}
This code is in the same file as above, only using "Variant 2" at line 88.
With this change alone, our time drops by 1.6x, to 11 seconds. Not only do we
spend much less CPU cycles on parsing, we also eliminate the allocation of a
temporary String.
And now, the perf stat report:
   144,186,177,966      branches
     1,654,689,761      branch-misses
     8,425,586,109      cache-references
       322,481,746      cache-misses
   271,487,424,445      cycles
   607,302,995,626      instructions
Instruction count dropped by another 1.6x, down to 607 per row.
The new flamegraph shows
that temperature parsing shrunk from 21% of total time to just 6%. The time
spent in stringAt() has also dropped, since we now call it only once. However,
it still looms large, at 35% of total time.
What can we do?
Optimization 3: Custom hashtable
We'd like to avoid calling stringAt() for the station name, because it
involves copying the data and initializing a new string instance. In almost all
cases, the only purpose of that instance is to find the existing entry in the
HashMap.
However, avoiding calls to stringAt() will be pretty hard to accomplish if we
stick to using HashMap. It expects that we pass in an instance of the key
class that is equal to an existing instance. We'd rather avoid that. So… maybe
we should build a custom hashtable?
This may sound crazy at first. Isn't Java supposed to already have a super-optimized HashMap implementation? Were they all lying to us when they said "don't be a smartass, use the standard library"?
Well, no. In general, they're totally right.
But here we have a highly specific, highly constrained problem, and we can do a
lot better with a custom implementation. Beyond our main motivation to get rid
of stringAt(), HashMap has to gracefully serve each and every use case, and
even defend from denial-of-service attacks.
We're fighting for every CPU cycle and want our implementation to do the bare minimum that serves the purpose.
On top of all that, you'll see that implementing an open-addressed hashtable with a predetermined size isn't all that much trouble. Here's most of the code you need (full code here):
private static final int HASHTABLE_SIZE = 2048;
private final StatsAcc[] hashtable = new StatsAcc[HASHTABLE_SIZE];

private StatsAcc findAcc(long cursor, long semicolonPos) {
    int hash = hash(cursor, semicolonPos);
    int slotPos = hash & (HASHTABLE_SIZE - 1);
    while (true) {
        var acc = hashtable[slotPos];
        if (acc == null) {
            acc = new StatsAcc(hash, cursor, semicolonPos - cursor);
            hashtable[slotPos] = acc;
            return acc;
        }
        if (acc.hash == hash && acc.nameEquals(chunk, cursor, semicolonPos)) {
            return acc;
        }
        slotPos = (slotPos + 1) & (HASHTABLE_SIZE - 1);
    }
}

private int hash(long startOffset, long limitOffset) {
    int h = 17;
    for (long off = startOffset; off < limitOffset; off++) {
        h = 31 * h + ((int) chunk.get(JAVA_BYTE, off) & 0xFF);
    }
    return h;
}

static class StatsAcc {
    long nameOffset;
    long nameLen;
    int hash;
    long sum;
    int count;
    int min;
    int max;

    StatsAcc(int hash, long nameOffset, long nameLen) {
        this.hash = hash;
        this.nameOffset = nameOffset;
        this.nameLen = nameLen;
    }

    public boolean nameEquals(MemorySegment chunk, long otherNameOffset, long otherNameLimit) {
        var otherNameLen = otherNameLimit - otherNameOffset;
        return nameLen == otherNameLen &&
                chunk.asSlice(nameOffset, nameLen).mismatch(chunk.asSlice(otherNameOffset, nameLen)) == -1;
    }
}
And here's the main loop that uses it:
for (var cursor = 0L; cursor < chunk.byteSize(); ) {
    var semicolonPos = findByte(cursor, ';');
    var newlinePos = findByte(semicolonPos + 1, '\n');
    var temp = parseTemperature(semicolonPos);
    var acc = findAcc(cursor, semicolonPos);
    acc.sum += temp;
    acc.count++;
    acc.min = Math.min(acc.min, temp);
    acc.max = Math.max(acc.max, temp);
    cursor = newlinePos + 1;
}
Instead of creating a string every time, now we just store the location of the name within the file. With this, we have completely eliminated allocation within the hot loop. The GC thread is now idle.
That's great on its own, but the main benefit is something else: zero allocation stops the churning of the CPU cache contents. Now the cache fills up with the hashtable data, which is very important because that's the part of our in-memory state where we can't avoid random access.
Now our runtime is down to 6.6 seconds, a 1.7x speedup — our approach was worth it.
Let's check in with perf stat:
    76,788,546,143      branches
     1,296,328,979      branch-misses
     4,669,021,999      cache-references
       147,634,298      cache-misses
   158,676,495,632      cycles
   367,267,766,472      instructions
We improved instructions-per row again by 1.6x. As predicted, cache misses improved even more, by 2.2x.
And our flamegraph? It now reveals
that 47% of total time is spent in findAcc — we'll see if we can improve that.
Also it points out that, as we optimized other things, 20% of our CPU time is
now spent parsing the temperature. Hmmmm. More to do!
But before we go on, let's check into how GraalVM is working for us. So far, we've been running all our optimization steps on GraalVM. But how would this code run on OpenJDK?
It would take 9.6 seconds, or 3.3 seconds slower than GraalVM. That's a 45% improvement!
Optimization 4: sun.misc.Unsafe, SWAR
So far, we have improved on our initial solution by a clean order of magnitude: from 66 seconds down to 6.6 seconds. Not bad. The techniques we applied are relatively simple to digest and use standard, safe Java.
Even if you stop reading here, you'll walk away with a set of tricks that can make you a performance hero in your own projects. But we want to push far beyond this level of performance!
For that, 1BRC contestants looked to more esoteric optimizations.
Some of them are obviously dangerous and can result in hard JVM crashes with a low-level Segmentation Fault. Others are highly specific to this challenge.
Readability and maintainability also take a big hit, while providing diminishing returns in performance. But, a challenge is a challenge, and the contestants pressed on without looking back!
For this next iteration, we'll apply a few techniques that all the top solutions shared:
-
Use
sun.misc.Unsafeinstead ofMemorySegmentto avoid bounds checks -
Avoid re-reading the same input bytes: reuse the same loaded value for hashing and semicolon search
-
Process the data 8 bytes at a time, using a SWAR technique to find the semicolon
-
Use @merykitty's magic SWAR (SIMD Within A Register) code to parse the temperature
Now check out the new hot loop. It's looking pretty alien:
long cursor = 0;
while (cursor < inputSize) {
    long nameStartOffset = cursor;
    long hash = 0;
    int nameLen = 0;
    while (true) {
        long nameWord = UNSAFE.getLong(inputBase + nameStartOffset + nameLen);
        long matchBits = semicolonMatchBits(nameWord);
        if (matchBits != 0) {
            nameLen += nameLen(matchBits);
            nameWord = maskWord(nameWord, matchBits);
            hash = hash(hash, nameWord);
            cursor += nameLen;
            long tempWord = UNSAFE.getLong(inputBase + cursor);
            int dotPos = dotPos(tempWord);
            int temperature = parseTemperature(tempWord, dotPos);
            cursor += (dotPos >> 3) + 3;
            findAcc(hash, nameStartOffset, nameLen, nameWord).observe(temperature);
            break;
        }
        hash = hash(hash, nameWord);
        nameLen += Long.BYTES;
    }
}
And wait till you see the methods this calls into:
private static final long BROADCAST_SEMICOLON = 0x3B3B3B3B3B3B3B3BL;
private static final long BROADCAST_0x01 = 0x0101010101010101L;
private static final long BROADCAST_0x80 = 0x8080808080808080L;

private static long semicolonMatchBits(long word) {
    long diff = word ^ BROADCAST_SEMICOLON;
    return (diff - BROADCAST_0x01) & (~diff & BROADCAST_0x80);
}

private static int nameLen(long separator) {
    return (Long.numberOfTrailingZeros(separator) >>> 3) + 1;
}

// credit: artsiomkorzun
private static long maskWord(long word, long matchBits) {
    long mask = matchBits ^ (matchBits - 1);
    return word & mask;
}

private static final long DOT_BITS = 0x10101000;
private static final long MAGIC_MULTIPLIER = (100 * 0x1000000 + 10 * 0x10000 + 1);

// credit: merykitty
private static int dotPos(long word) {
    return Long.numberOfTrailingZeros(~word & DOT_BITS);
}

// credit: merykitty and royvanrijn
private static int parseTemperature(long numberBytes, int dotPos) {
    // numberBytes contains the number: X.X, -X.X, XX.X or -XX.X
    final long invNumberBytes = ~numberBytes;

    // Calculates the sign
    final long signed = (invNumberBytes << 59) >> 63;
    final int _28MinusDotPos = (dotPos ^ 0b11100);
    final long minusFilter = ~(signed & 0xFF);
    // Use the pre-calculated decimal position to adjust the values
    final long digits = ((numberBytes & minusFilter) << _28MinusDotPos) & 0x0F000F0F00L;

    // Multiply by a magic (100 * 0x1000000 + 10 * 0x10000 + 1), to get the result
    final long absValue = ((digits * MAGIC_MULTIPLIER) >>> 32) & 0x3FF;
    // And apply the sign
    return (int) ((absValue + signed) ^ signed);
}
That's a lot of bit-twiddling magic, but note one general thing: there are
almost no if statements, and that's the point. We replaced branch instructions
with straight-through bitwise calculation.
The CPU tries to predict whether it will go into the "then" or the "else" branch
for each if statement, based on previous iterations. As a result, it starts to
decode the appropriate instructions before having all the data ready to evaluate
the condition.
So, whenever it gets it wrong, it has to discard all that work and start to decode the other instructions. As a rule of thumb, a single branch misprediction costs as much as 10-15 instructions.
We also applied the SWAR idea: SIMD Within A Register, which means treating a
long number as a vector of 8 byte values, and performing the same operation on
each.
In our case, semicolonMatchBits() locates the ASCII semicolon byte and returns
a long with bits set to one where it was found. Then the method nameLen()
turns that bit pattern into the number telling us where it is. This comes from a
standard technique, used for example in C to efficiently determine the length of
a zero-terminated string.
Read a detailed explanation of a very similar approach in this insightful post Finding Null Terminators without Branches by Richard Startin.
The method maskWord() takes a long containing 8 bytes of input data and
zeroes out all the bytes beyond the semicolon. We need this to perform a fast
name equality check.
The algorithm in parseTemperature() and dotPos() is a genius creation by
@merykitty (Quan Anh Mai), who made it
specifically for this challenge. It leverages the properties of the bit patterns
of ASCII - and ., as well as several other tricks, and produces the integer
value of the two or three temperature digits, accounting for all four possible
patterns (X.X, -X.X, XX.X and -XX.X) in one go.
If you want to study it in more detail, keep in mind that the number string is
stored in the long in little-endian order. For example, this line:
long signed = (invNumberBytes << 59) >> 63; isolates bit number 4 of the first
byte – the one where the minus sign may appear – and sign-extends it across the
long.
This bit is 0 in the - sign, and 1 in all the digits. The operation is done
after flipping all the bits (~numberBytes), so this becomes either all 1's if
the byte is -, or all 0's otherwise.
This parsing code deserves a blog post of its own, and it would distract us too much to explain it in detail here. Instead I've thrown in @merykitty's original code, and expanded his comments a bit more:
// credit: merykitty
// word contains the number: X.X, -X.X, XX.X or -XX.X
private static int parseTemperatureOG(long word, int dotPos) {

    // signed is -1 if negative, 0 otherwise
    final long signed = (~word << 59) >> 63;
    final long removeSignMask = ~(signed & 0xFF);

    // Zeroes out the sign character in the word
    long wordWithoutSign = word & removeSignMask;

    // Shifts so that the digits come to fixed positions:
    // 0xUU00TTHH00 (UU: units digit, TT: tens digit, HH: hundreds digit)
    long digitsAligned = wordWithoutSign << (28 - dotPos);

    // Turns ASCII chars into corresponding number values. The ASCII code
    // of a digit is 0x3N, where N is the digit. Therefore, the mask 0x0F
    // passes through just the numeric value of the digit.
    final long digits = digitsAligned & 0x0F000F0F00L;

    // Multiplies each digit with the appropriate power of ten.
    // Representing 0 as . for readability,
    // 0x.......U...T.H.. * (100 * 0x1000000 + 10 * 0x10000 + 1) =
    // 0x.U...T.H........ * 100 +
    // 0x...U...T.H...... * 10 +
    // 0x.......U...T.H..
    //          ^--- H, T, and U are lined up here.
    // This results in our temperature lying in bits 32 to 41 of this product.
    final long absValue = ((digits * MAGIC_MULTIPLIER) >>> 32) & 0x3FF;

    // Apply the sign. It's either all 1's or all 0's. If it's all 1's,
    // absValue ^ signed flips all bits. In essence, this does the two's
    // complement operation -a = ~a + 1. (All 1's represents the number -1).
    return (int) ((absValue ^ signed) - signed);
}
All these techniques put together result in a 2.8x speedup. From 6.6 seconds, we're now down to 2.4 seconds. Our overall improvement is now 28x.
As perf stat reports:
    13,612,256,700      branches
       656,550,701      branch-misses
     3,762,166,084      cache-references
        92,058,104      cache-misses
    63,244,307,290      cycles
   119,581,792,681      instructions
There is a huge drop in instruction count, by 3x. Since that's just 120
instructions per row now, we should look into making the same number of
instructions execute faster. One thing stands out: there are 0.66
branch-misses per row.
Can we do something about that?
Optimization 5: Win with statistics
The flamegraph for our current
solution indicates that the relative impact of methods hasn't changed much. The
CPU spends 45% of its time total inside findAcc(), and just nameEquals()
alone takes 19%:
boolean nameEquals(long inputBase, long inputNameStart, long inputNameLen, long lastInputWord) {
    int i = 0;
    for (; i <= inputNameLen - Long.BYTES; i += Long.BYTES) {
        if (getLong(inputBase, inputNameStart + i) != name[i / 8]) {
            return false;
        }
    }
    return i == inputNameLen || lastInputWord == name[i / 8];
}
On the surface, that looks pretty efficient. It compares the station names eight
bytes at a time, and even uses the trick of reusing the mask operation on the
last block, passing it in as lastNameWord. But, it has a loop, which results
in unpredictable branching, and it re-reads the input name from memory.
How do we know the branch instruction in the loop will be unpredictable? The answer lies in the statistics of the station names.
If most of the names are less than 8 bytes long, the condition that decides whether to go into another iteration will almost always be false, and that will result in a predictable branch instruction.
So, what's the actual distribution of the name lengths? While doing the challenge, I wrote some code on the side, in a file called Statistics.java, to find out things like that.
The distribution() method prints out the statistical distribution of name
lengths. If you run it on a dataset generated using one of the scaffolding
scripts (create_meauserements.sh) from the 1BRC repo, you'll see that there's
an almost even split between the names up to and longer than 8 bytes.
I also wrote a method that simulates the CPU's branch prediction
(branchPrediction()
in the same file). The CPU has a Branch History Table (BHT) that tracks the
behavior of each branch instruction in the hot loop.
An entry in the table is a 2-bit saturating counter which increments/decrements depending on the outcome of the branch condition. Instead of overflowing, it gets stuck at the min/max value (in other words, it saturates). When the counter is 0 or 1, it predicts that the branch will be taken; if it's 2 or 3, in predicts it won't be taken.
Running Statistics.branchPrediction() with the condition
nameLen > 8
results in 50% branch mispredictions. But if we change the condition in that
line of code to nameLen > 16, mispredictions drop to just 2.5%.
Informed by this finding, it's clear that we have to write some code to avoid
any branch instructions on the condition nameLen > 8, and instead go directly
for nameLen > 16.
To do that, we have to unroll the semicolon-searching loop along these lines:
- Perform the first two steps in one go, without checking any conditions
- Use bit-twiddling logic to combine the results of finding the semicolon in
each of the two
longwords - Use the combined result in an
ifcheck, which now accounts for all the initial 16 bytes
We also need specialized variants of findAcc() and nameEquals() for the
cases where the name is up to 16 bytes or more.
In my solution, this reduces the time to 1.8 seconds — another 33% improvement, for the new total improvement of ~40x.
And perf stat confirms our reasoning:
     8,227,092,155      branches
        84,323,925      branch-misses
     3,219,383,623      cache-references
        69,268,236      cache-misses
    44,893,388,140      cycles
    98,225,209,459      instructions
There's only a modest improvement in instructions per row, from 120 to 98. But look at "branch-misses"! It dropped almost 8 times, from 0.657 to 0.084 per row.
This explains most of the speed improvement. Cache misses dropped as well, from 0.092 to 0.069 per row. This probably comes from the improved memory layout of our stats accumulator, which now stores the first 16 name bytes inside the class instance, and not in the separately-allocated array.
Another metric that people like to track is instructions-per-cycle (IPC). We can see that it improved in this last step from 1.89 to 2.19. Reducing branch mispredictions means that the CPU has to do a lot less rework, discarding the speculatively executed instructions. This combines with the drop in instructions-per-row to explain the overall 33% improvement.
Optimization 6: Eliminate startup/cleanup costs
If we want to compare our current result of 1.8 seconds to the winner, 1.5 seconds, we have to take into account the measurement methodology.
All along this post, we've been reporting inner timings, that the code reports for itself. The outer timing, as measured in the contest, includes both the JVM startup and cleanup at the end. This adds 200 milliseconds - so we're actually at 2.0 seconds compared to 1.5 seconds.
@thomaswue realized that around half of this time, 100 ms, is spent on unmapping the memory-mapped file after the output is already produced. He found a way to avoid paying for this with a hack, which was immediately copied by all the other top contenders. He started a subprocess that would actually do the work, so that the parent process could end as soon as it forwarded all the output. It would then leave the subprocess to clean up in the background.
For this trick to work, contestants had to eliminate the JVM startup time as well, otherwise they'd pay for it twice. This would cancel out all the improvement! As a result, this forced everyone to also use ahead-of-time compilation into a native binary.
With these two tricks added, our outer timing becomes almost identical to the inner timing we've been reporting, which means we are truly getting close!
Optimization 7: Use smaller chunks and work stealing
At this point, we're deep into low-level optimization territory. The tricks that further improve the timing are coupled to the detailed specifics of everything, such as:
- CPU make and model
- Architecture of the connection to the RAM subsystem
- Minute details of the compiler
Explaining all these tricks would get us deep into the weeds, and wouldn't be reusable knowledge. Instead let me show you one last trick that's kind of cute, and might come in handy in real-life scenarios.
The way we divide the work into a single chunk per thread, we can end up with some threads getting "luckier" than others and completing sooner. When that happens, the CPU is underutilized for the remaining computation.
To address this, we can introduce a small update that changes this to a larger number of small, fixed-size chunks. Up-front we'll only calculate the number of chunks, and then let the threads grab them and calculate their bounds when they're ready.
The key element is in ensuring that every chunk gets processed exactly once.
And the beauty of it is that it's almost a one-liner:
static int chunkCount;
static final AtomicInteger chunkSelector = new AtomicInteger();

...
// at program start:
chunkCount = (int) ((file.length() / CHUNK_SIZE - 1) + 1);

...
// in the worker thread:
var selectedChunk = chunkSelector.getAndIncrement();
if (selectedChunk >= chunkCount) {
    break;
}
And that's it! All the magic happens in the atomic counter we increment. This trick ekes out one last tenth of a second, down to 1.7 seconds.
Conclusion
At the end of our 1BRC speedrun, we managed a 42x improvement over the Parallel Streams implementation on OpenJDK, from 71 seconds down to 1.7. You may notice that my official 1BRC result was quite a bit worse, at 2.3 seconds. The code in this post is different from what I submitted; some of it I wrote just for the post. It turned out that I had to choose between one last round of optimization at 1BRC, or giving full attention to the challenge I got while getting hired for QuestDB. I'm very glad I chose the latter!
Performance optimizations we went through are certainly impressive, but do keep in mind that a lot of the gains come from dispensing with all the best practices that apply to production code: validations, bounds checks, hashtable resizing, and so on.
The sole purpose of this code was to be fast at one very particularly specified, error-free input file. It has absolutely no tolerance for any kind of deviation, for example a single temperature reading that exceeds the three-digit maximum would cause it to completely lose track, and probably crash.
But, coding challenges are meant to be fun — and everybody knows input validation is the opposite of fun!