The idea of quant trading is to try and find new predictive signals to derive profitable trading strategies. As a result there are a plethora of market signals, from simple widespread ones used by retail outlets to complicated proprietary strategies employed by hedge funds.
In this article, we'll look at using QuestDB queries in a Grafana dashboard to derive and test simple trading signals. We will use the Coinbase crypto market data as the underlying source of data. If you wish to follow along, please refer to our tutorial on setting up QuestDB and Grafana via Docker or visit the Grafana docs.
Calculating a moving average
A moving average computes the average price of a stock over a rolling window of time. Conveniently, this is a strong use of QuestDB's newly released window functions.
We can define a moving average in a query as follows:
SELECT timestamp time,
       symbol,
       price,
       avg(price)
       OVER (PARTITION BY symbol
             ORDER BY timestamp
             RANGE 1 HOUR PRECEDING ) moving_average_1h,
FROM trades
WHERE $__timeFilter(timestamp)
AND   symbol = $Pairs
The moving average would look like the following…
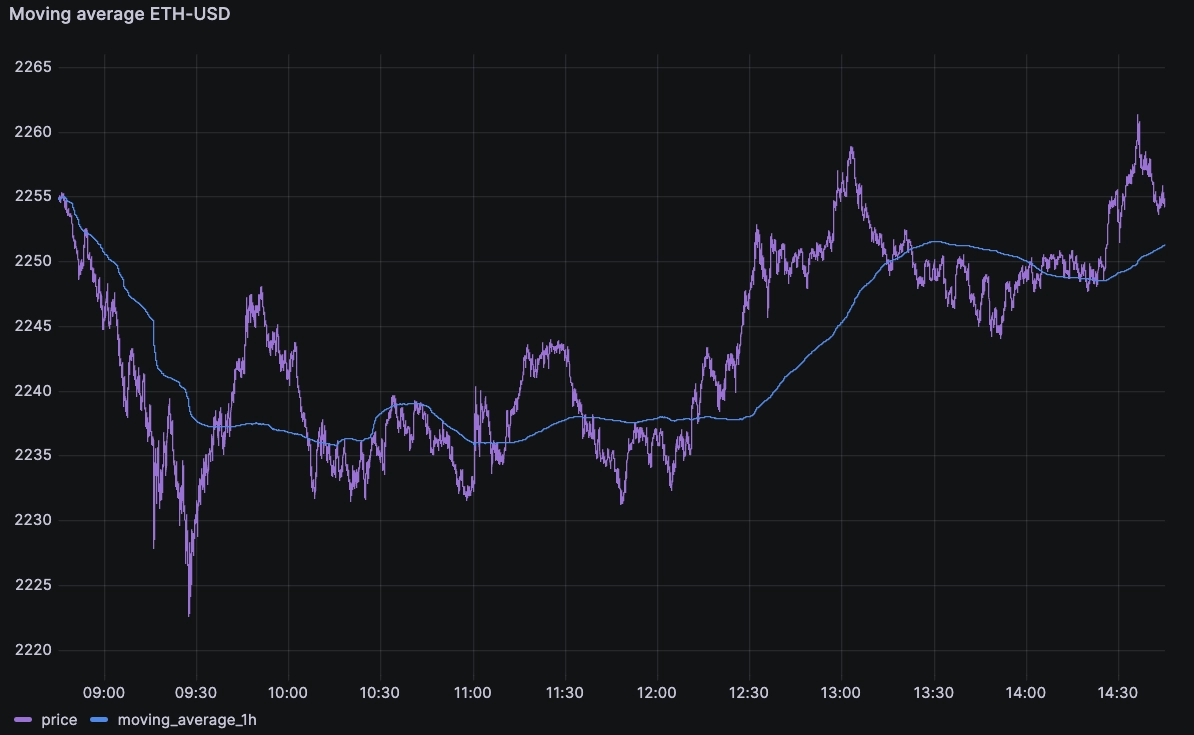
Moving average as a technical analysis indicator
Technical analysis refers to analysis based solely on chart data. This contrasts with other types of analysis, such as fundamental analysis which looks at the underlying value of the assets to determine its market price. For example, for a stock price, this would mean analyzing the company's business operations and cash flows to derive a value for the stock price.
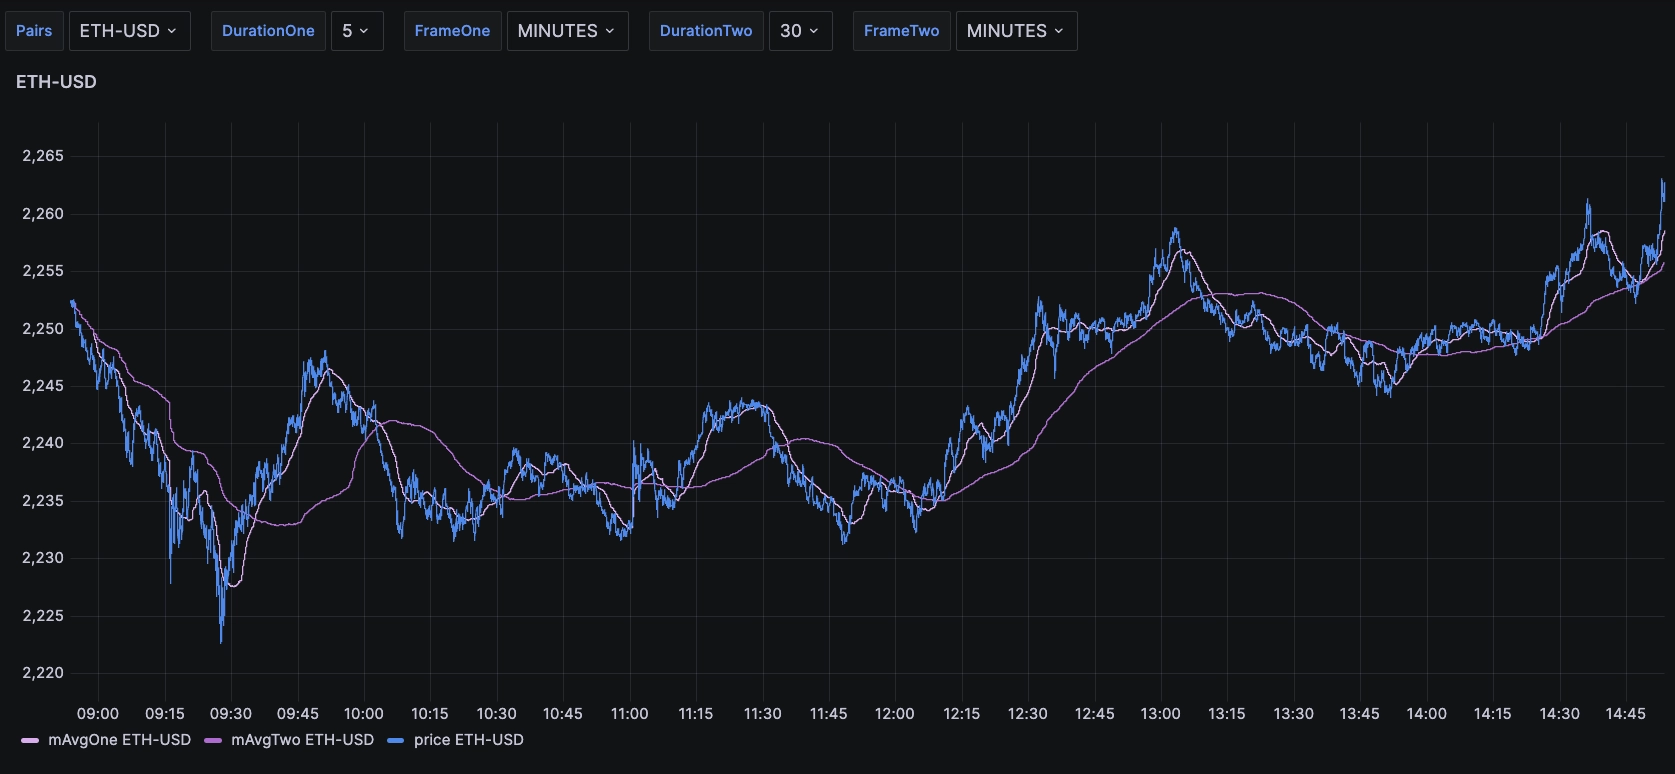
Moving averages are part of the technical analysis spectrum. The typical way moving averages are looked at from a signal point of view is that the crossing of two moving averages over different time intervals indicates the reversal of a trend, and therefore an opportunity to trade.
For example, if the shorter term moving average crosses the longer term from the bottom, then this would indicate a buy signal, and a crossing from the opposite direction would indicate a sell signal. There are, of course, many limits to this.
First - and by definition - the moving average looks at past price data. The underlying assumption is that the chart data for a given asset is, in itself, a predictor of upcoming chart data. Another way to frame that is as a projected price path.
In addition, this data is lagging by definition and therefore the indicator would lag as well. The counterpoint to these arguments on technical analysis is that it can sometimes explain price action on assets that don't have much underlying value other than that created through speculation. Whether this is a good indicator or not is outside of our scope, but we thought it would be good to mention some context.
From here, we can build an indicator by adding another moving average to our initial query with a different period. We will make these two periods variable by using Grafana variables:
SELECT timestamp AS time,
       symbol,
       price,
       AVG(price) OVER (
            ORDER BY timestamp
            RANGE '$DurationOne' $FrameOne PRECEDING
       ) AS mAvgOne,
       AVG(price) OVER (
            ORDER BY timestamp
            RANGE '$DurationTwo' $FrameTwo PRECEDING
       ) AS mAvgTwo
FROM trades
WHERE $__timeFilter(timestamp)
AND   symbol = $Pairs
Window functions in QuestDB
Before we dig deeper, a quick explanation of window functions for those who may
be unfamiliar. In QuestDB, a window function is defined by an OVER clause that
follows the window function. This clause includes three components:
partitioning, ordering and frame
specification.
The PARTITION BY clause divides the result set into partitions (groups of
rows) upon which the window function is applied. The ORDER BY clause within
the OVER clause determines the order of the rows in each partition. The frame
specification defines the set of rows included in the window, relative to the
current row.
Window functions in QuestDB are often used in analytics for tasks such as calculating running totals or averages, finding the maximum or minimum value in a sequence or partition, ranking items within a specific category or partition, and calculating or cumulative sums. And, of course, to calculate moving averages.
Extracting a signal
Having built this query, we can now use a subquery to extract the signal of when the values are crossing and then overlay it on our charts.
WITH data AS (
    SELECT timestamp AS time,
           symbol,
           price,
           AVG(price) OVER (
               ORDER BY timestamp
               RANGE '$DurationOne' $FrameOne PRECEDING
           ) AS mAvgOne,
           AVG(price) OVER (
               ORDER BY timestamp
               RANGE '$DurationTwo' $FrameTwo PRECEDING
           ) AS mAvgTwo
    FROM trades
    WHERE $__timeFilter(timestamp)
    AND   symbol = $Pairs
)
SELECT time,
       symbol,
       (mAvgOne - mAvgTwo) AS difference
FROM data
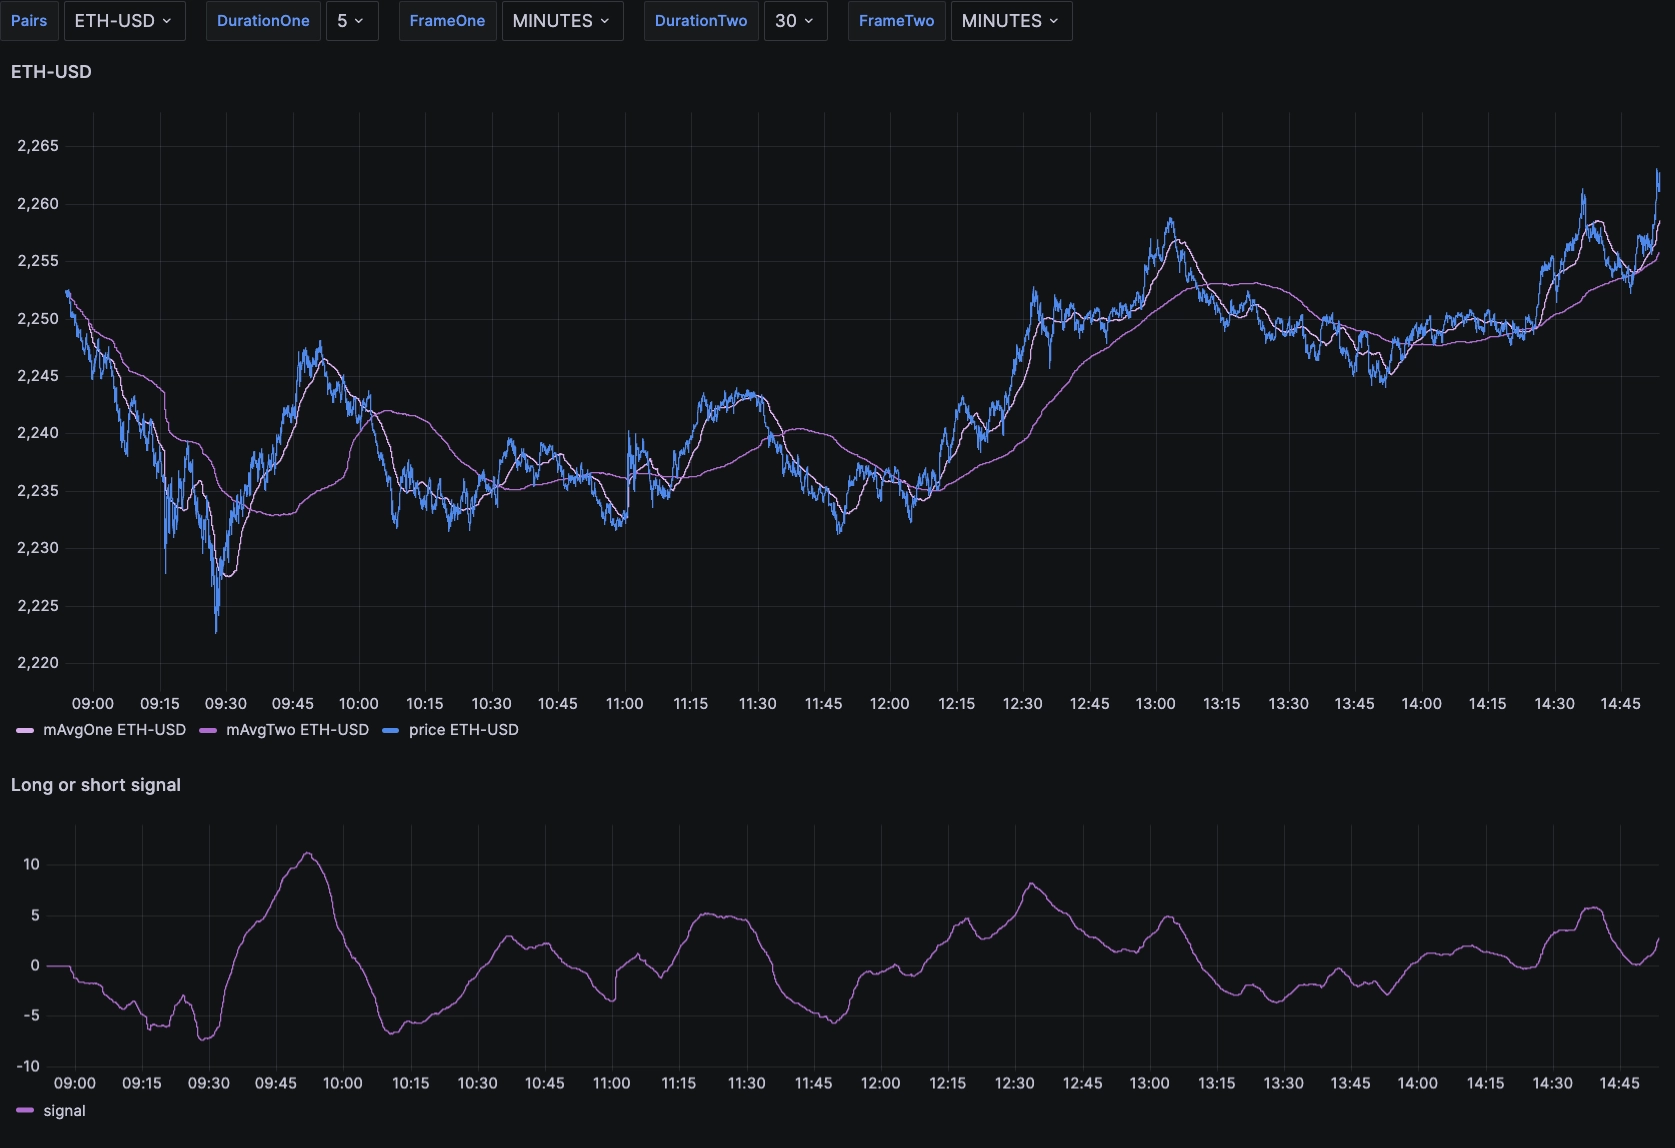
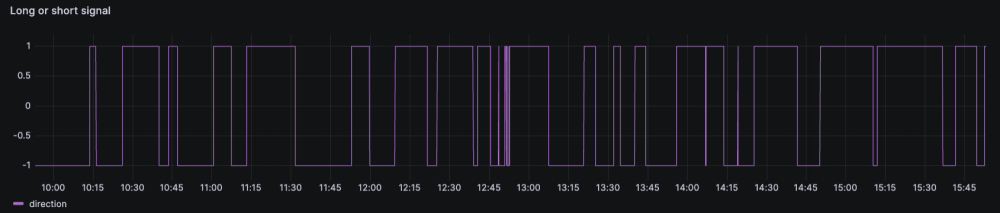
The line shows the difference between the two moving averages. When this difference crosses zero, then could a strong signal. We therefore need to transform the analog line above into two pieces of binary information:
- A trade action signal (do nothing or trade)
- A direction signal (buy or sell)
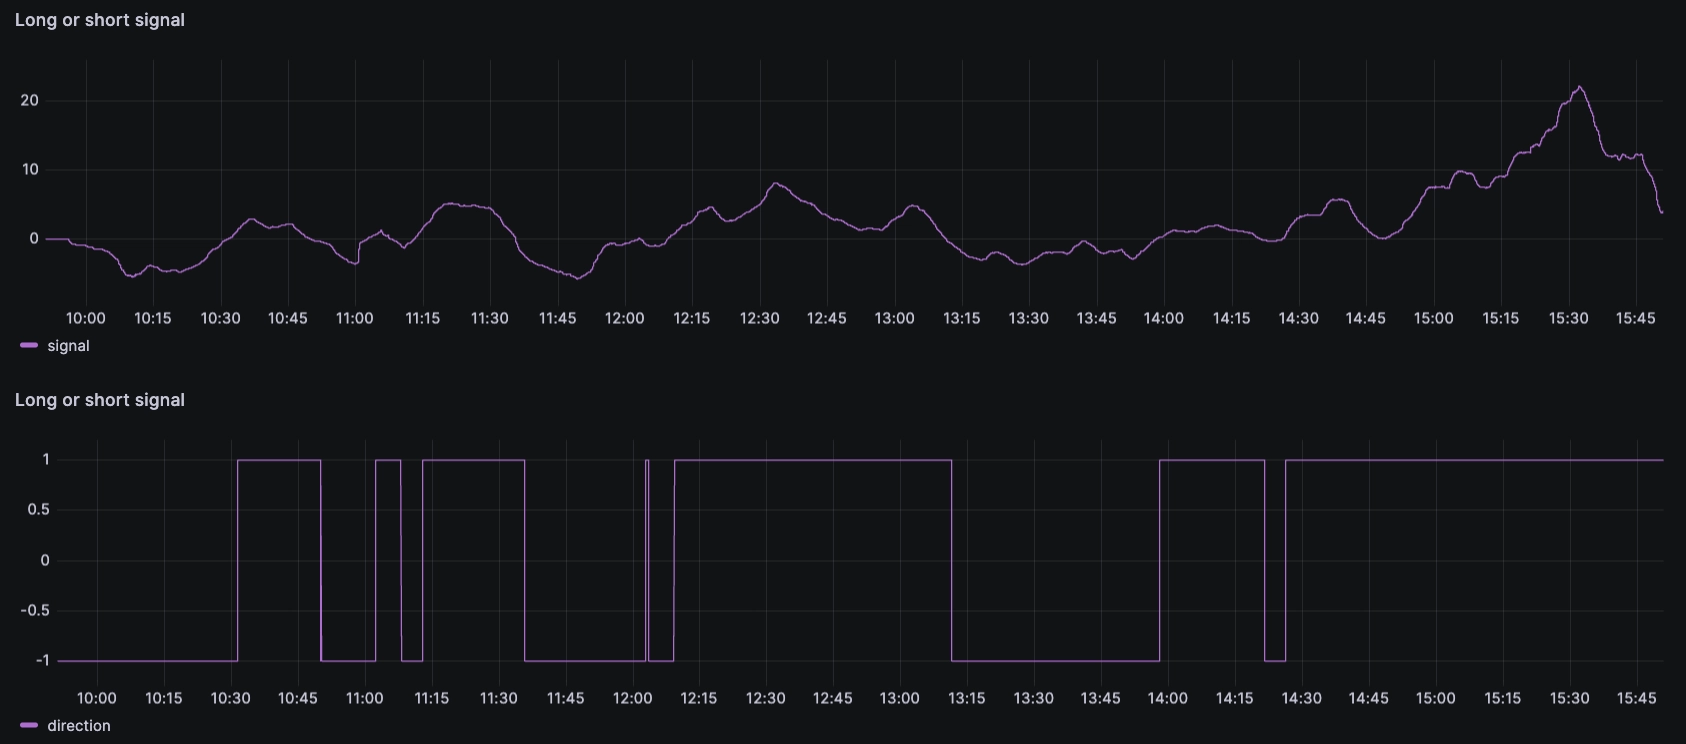
The direction is simple: if the difference between the short term and the long
term moving averages is positive, then the signal should be 'buy'. Otherwise, it
should be sell. Shown with a CASE function to output -1 if the strategy
output is a short position and 1 if long.
WITH data AS (
    SELECT timestamp AS time,
           symbol,
           price,
           AVG(price) OVER (
               ORDER BY timestamp
               RANGE '$DurationOne' $FrameOne PRECEDING
           ) AS mAvgOne,
           AVG(price) OVER (
               ORDER BY timestamp
               RANGE '$DurationTwo' $FrameTwo PRECEDING
           ) AS mAvgTwo
    FROM trades
    WHERE $__timeFilter(timestamp)
    AND   symbol = $Pairs
)
SELECT time,
       symbol,
       CASE WHEN (mAvgOne - mAvgTwo) > 0 THEN 1
            ELSE -1
       END AS direction
FROM data
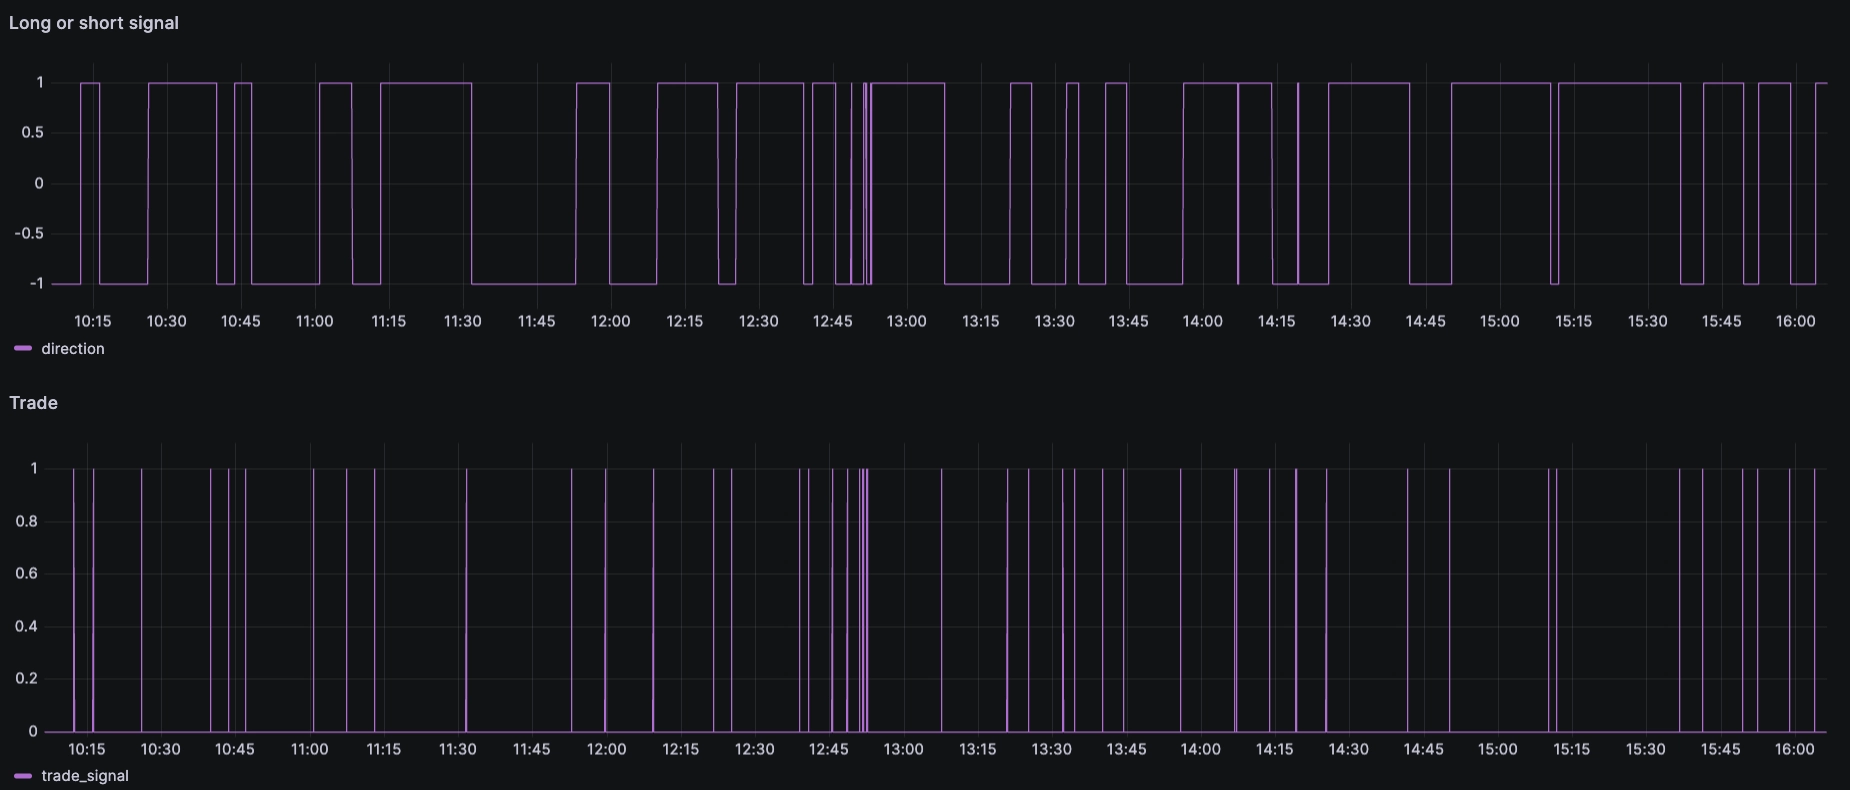
We can also vary the frequency, for example with shorter moving average intervals. Unsurprisingly, for the same data, it results in a higher frequency of trades:
Lastly, we need to extract the moment we should trade. To do this, we can check
for the moment that the direction signal changes by running an average query
over two rows. If the average is zero, then the two surrounding values are of
opposite signs (1 and -1). We can then conclude there was a change in the
direction signal and should therefore make a trade.
WITH data AS (
    SELECT timestamp,
           symbol,
           AVG(price) OVER (
               ORDER BY timestamp
               RANGE '$DurationOne' $FrameOne PRECEDING
           ) AS mAvgOne,
           AVG(price) OVER (
               ORDER BY timestamp
               RANGE '$DurationTwo' $FrameTwo PRECEDING
           ) AS mAvgTwo
    FROM trades
    WHERE symbol = $Pairs
    AND   $__timeFilter(timestamp)
)
SELECT  ts,
        CASE
            WHEN abs(averageCheck) <= 0 THEN 1
            ELSE 0
        END
FROM (
    SELECT ts,
           AVG(Xdirection) OVER (
               ORDER BY ts
               ROWS 1 PRECEDING
           ) AS averageCheck
    FROM (
        SELECT timestamp AS ts,
               symbol,
               CASE
                   WHEN (mAvgOne - mAvgTwo) > 0 THEN 1
                   ELSE -1
               END AS Xdirection
        FROM data
    )
)
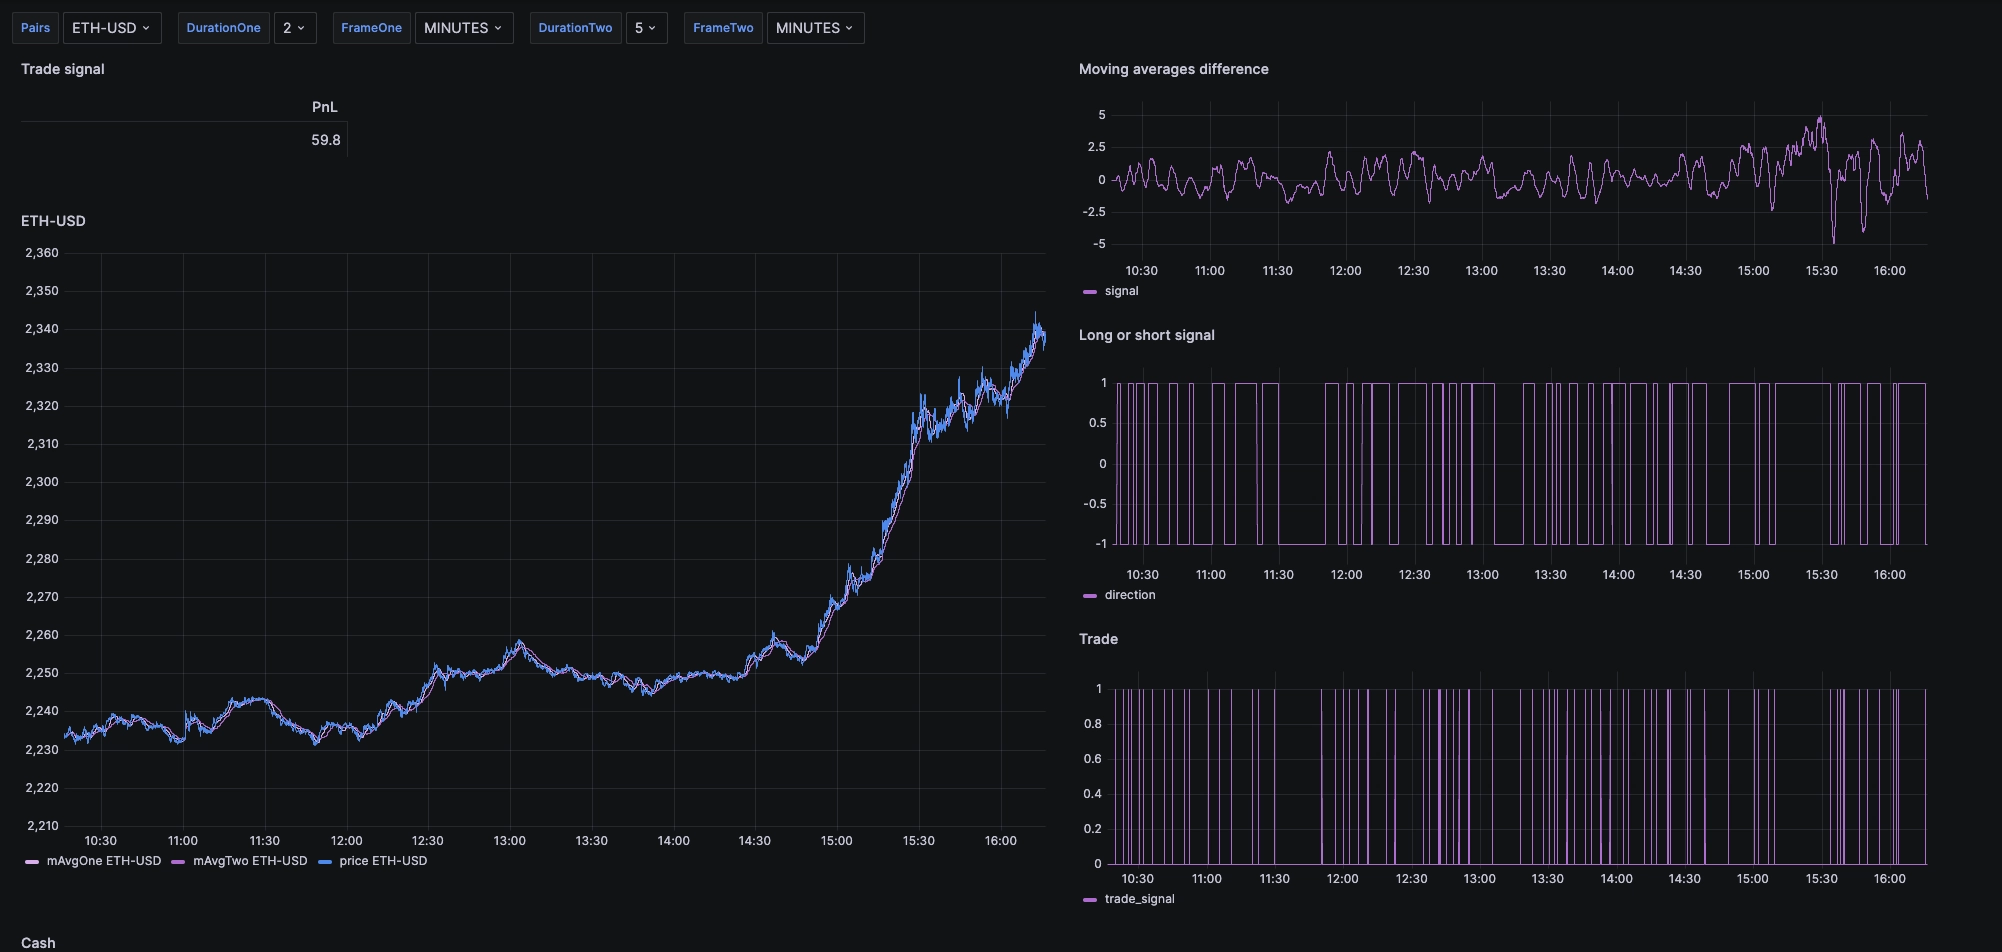
Having done this, we can vary the symbols, time frames and the window sizes for both moving averages to try different combinations.
Strategic profits and losses
Does the strategy make money? Or perhaps more importantly, does it make good risk-adjusted returns? Probably not, but we can check by adjusting the previous query to simulate a trade at the last price whenever the signal is triggered. While this is not an efficient way of doing this, it's fun!
And hey, in this very scenario, we could have made 60 bucks… If we traded over 50 times, or over 110K USD notional. Guess we'll need to find another strategy!
Summary
In this article, we explored the concept of moving averages as a trading signal using QuestDB queries in a Grafana dashboard, with Coinbase crypto market data as our source. We discussed how moving averages, a form of technical analysis, can indicate potential trading opportunities when two averages over different time intervals cross. We then demonstrated how to build an indicator by adding another moving average to our initial query with a different period, and how to extract a signal when these values cross.
We also discussed how to determine the direction of the trade (buy or sell) based on the difference between the short term and the long term moving averages, and how to identify the moment to trade by checking for the moment that the direction signal changes by running an average query over two rows.
Finally, we touched on the strategy's profitability and risk-adjusted returns, and demonstrated how to simulate a trade at the last price whenever the signal is triggered. Have fun and good luck!
Checkout our real time (crypto dashboard)[/dashboards/crypto] for further inspiration.