Grafana
Grafana is a popular observability and monitoring application used to visualize data and enable time-series data analysis.
QuestDB is available within Grafana via the official QuestDB plugin.
For a walk-through style guide, see our blog post.
Prerequisites
- Docker to run both Grafana and QuestDB
- We will use the
--add-hostparameter for both Grafana and QuestDB.
- We will use the
Start Grafana
Start Grafana using docker run:
docker run --add-host=host.docker.internal:host-gateway \
-p 3000:3000 --name=grafana \
-v grafana-storage:/var/lib/grafana \
grafana/grafana-oss
Once the Grafana server has started, you can access it via port 3000 (http://localhost:3000). The default login credentials are as follows:
user:admin
password:admin
Start QuestDB
The Docker version runs on port 8812 for the database connection and port
9000 for the Web Console and REST interface:
docker run --add-host=host.docker.internal:host-gateway \
-p 9000:9000 -p 9009:9009 -p 8812:8812 -p 9003:9003 \
-v "$(pwd):/var/lib/questdb" \
-e QDB_PG_READONLY_USER_ENABLED=true \
questdb/questdb:latest
Add a data source
- Open Grafana's UI (by default available at http://localhost:3000)
- Navigate to the bottom of the page and click Find more data source plugins.
- Search for QuestDB and click Install.
- Once the QuestDB data source for Grafana is finished installing, click on the blue Add new data source button where the Install button used to be. Configure it with the following settings:
Server address:host.docker.internal
Server port: 8812
Username:user
Password:quest
TLS/SSL mode:disable
-
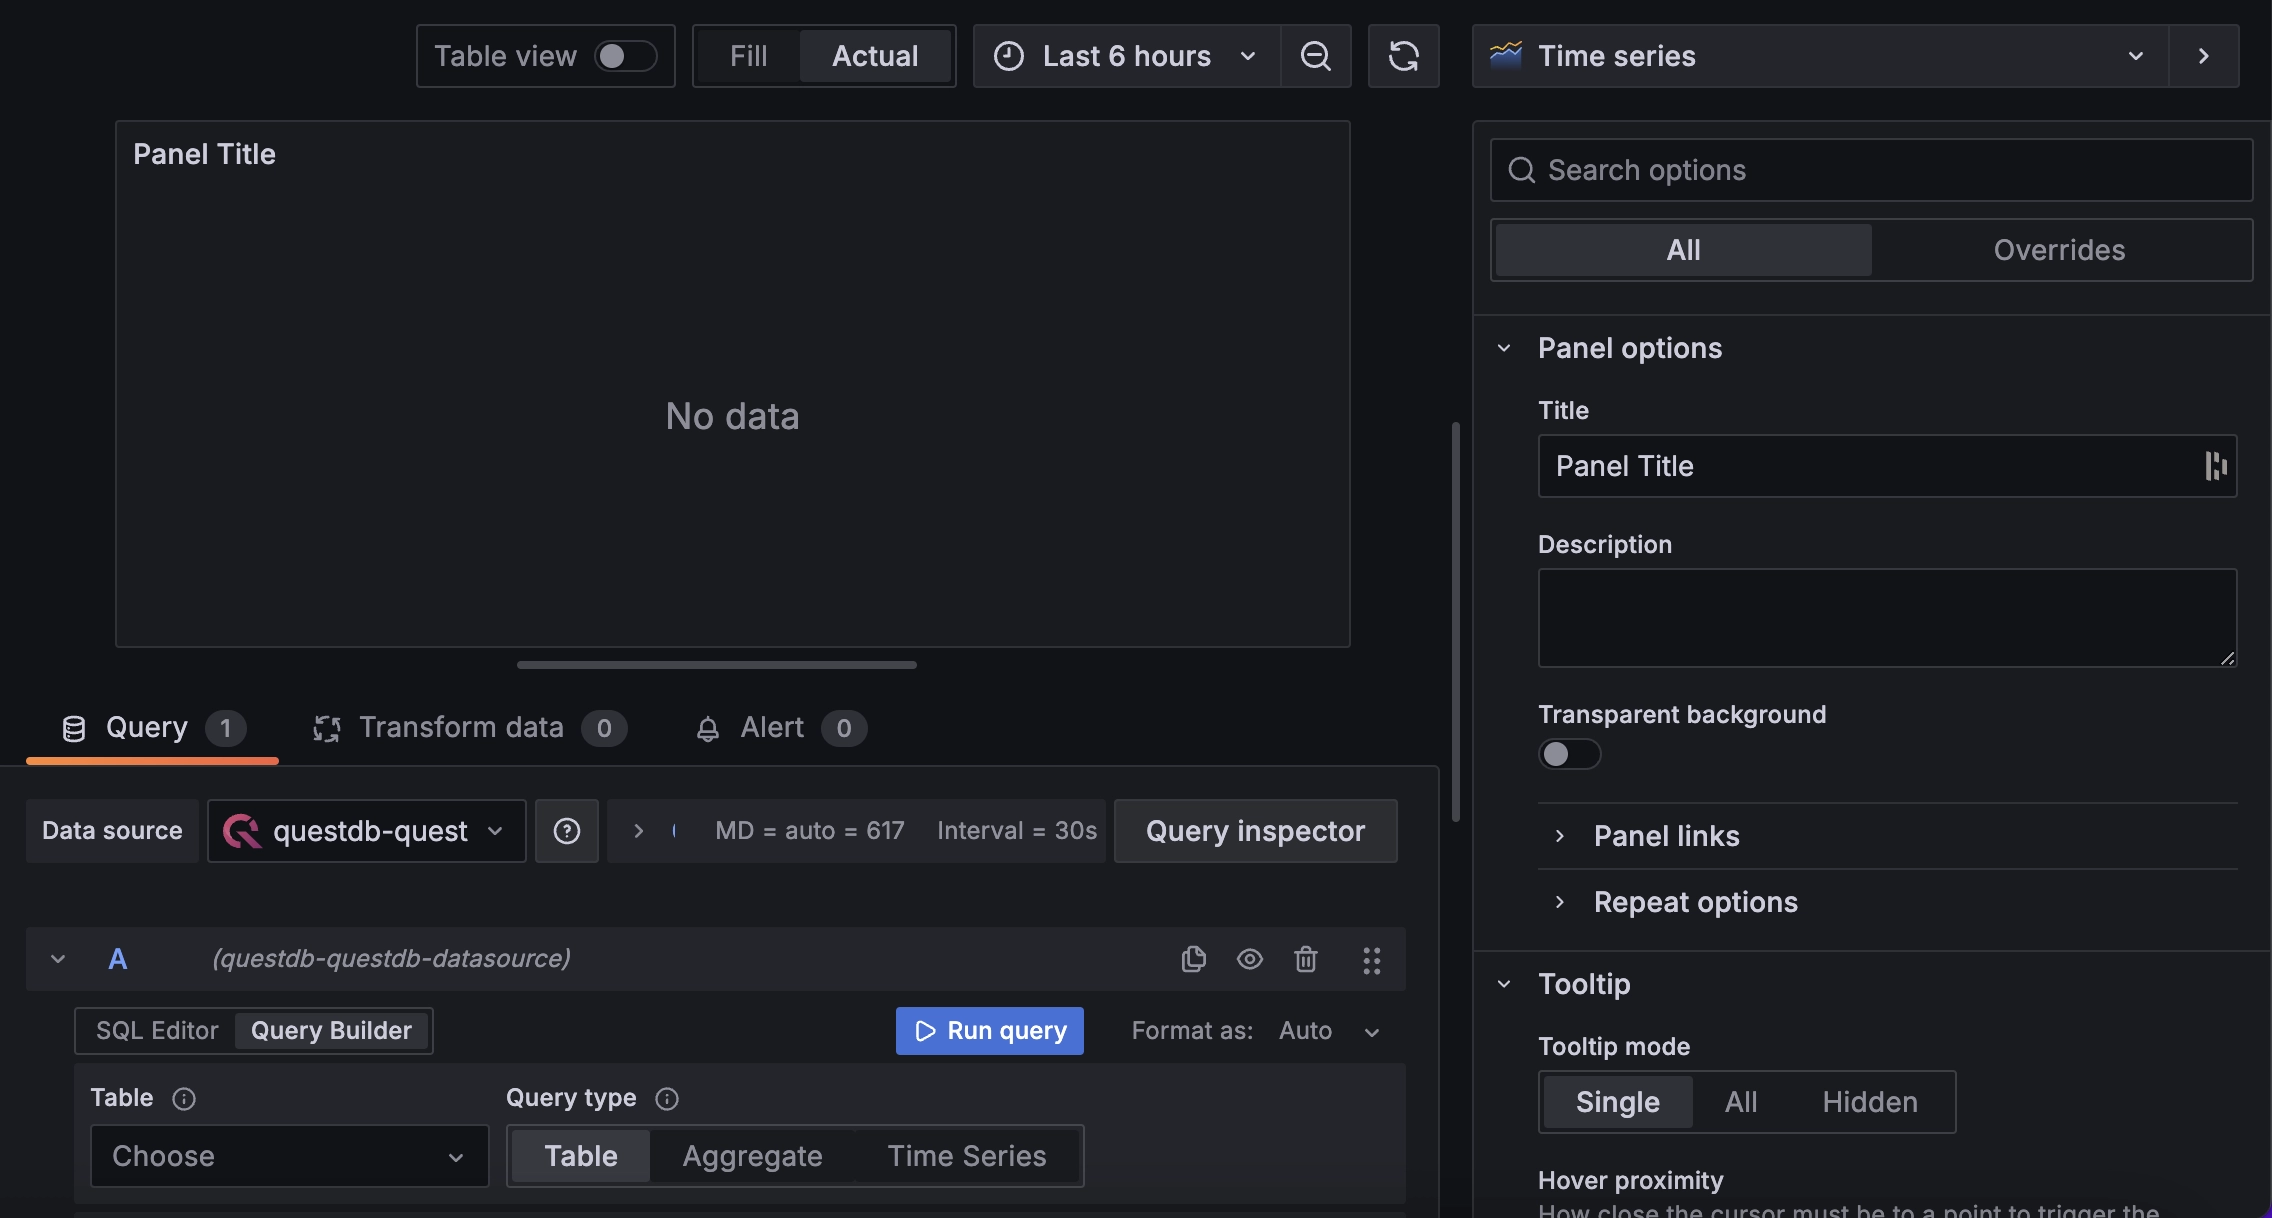
Toggle the Query Builder to SQL Editor by clicking the button.
-
Write SQL queries!
Real-time refresh rates
By default, Grafana limits the maximum refresh rate of your dashboards. The maximum default rate is to refresh every 5 seconds. This is to provide relief to the database under-the-hood. However, with QuestBD's significant performance optimizations, we can lower this rate for greater fluidity.
To learn how, see our blog post.
Global variables
Use global variables to simplify queries with dynamic elements such as date range filters.
$__timeFilter(timestamp)
This variable allows filtering results by sending a start-time and end-time to QuestDB. This expression evaluates to:
timestamp BETWEEN
    '2018-02-01T00:00:00Z' AND '2018-02-28T23:59:59Z'
$__interval
This variable calculates a dynamic interval based on the time range applied to the dashboard. By using this function, the sampling interval changes automatically as the user zooms in and out of the panel.
SELECT
  pickup_datetime AS time,
  avg(trip_distance) AS distance
FROM taxi_trips
WHERE $__timeFilter(pickup_datetime)
SAMPLE BY $__interval;