Telegraf
Telegraf is a client for collecting metrics from many inputs and has support for sending it on to various outputs. It is plugin-driven for the collection and delivery of data, so it is easily configurable and customizable. Telegraf is compiled as a standalone binary, which means there are no external dependencies required to manage.
QuestDB supports ingesting from Telegraf via the InfluxDB Line Protocol. This page provides examples for collecting CPU and memory usage metrics using Telegraf and sends these metrics to a locally-running QuestDB instance for querying and visualization.
Prerequisites
-
QuestDB must be running and accessible. Checkout the quick start.
-
Telegraf can be installed using homebrew, docker, or directly as a binary. For more details, refer to the official Telegraf installation instructions.
Configuring Telegraf
As Telegraf is a plugin-driven agent, the configuration file provided when Telegraf is launched will determine which metrics to collect, if and how processing of the metrics should be performed, and the destination outputs.
The default location that Telegraf can pick up configuration files is
/usr/local/etc/ on macOS and /etc/telegraf/ on Linux. After installation,
default configuration files are in the following locations:
- Homebrew install:
/usr/local/etc/telegraf.conf - Linux, Deb and RPM:
/etc/telegraf/telegraf.conf
Full configuration files for writing are provided below and can be placed in these directories and picked up by Telegraf. To view a comprehensive configuration file with example inputs and outputs, the following command can generate an example:
telegraf -sample-config > example.conf
Example Inputs
The examples on this page will use input plugins that read CPU and memory usage statistics of the host machine and send this to the outputs specified in the configuration file. The following snippet includes code comments which describe the inputs in more detail:
...
# -- INPUT PLUGINS -- #
[[inputs.cpu]]
  # Read metrics about cpu usage
  ## Whether to report per-cpu stats or not
  percpu = true
  ## Whether to report total system cpu stats or not
  totalcpu = true
  ## If true, collect raw CPU time metrics
  collect_cpu_time = false
  ## If true, compute and report the sum of all non-idle CPU states
  report_active = false

# Read metrics about memory usage
[[inputs.mem]]
  # no customisation
Writing to QuestDB over HTTP
QuestDB expects Influx Line Protocol messages over HTTP on port 9000. To change
the default port, see the HTTP server configuration
section of the server configuration page.
Create a new file named questdb.conf in one of the locations Telegraf can
load configuration files from and paste the following example:
# Configuration for Telegraf agent
[agent]
  ## Default data collection interval for all inputs
  interval = "5s"
  hostname = "qdb"

# -- OUTPUT PLUGINS -- #
[[outputs.influxdb_v2]]
# Use InfluxDB Line Protocol to write metrics to QuestDB
  urls = ["http://localhost:9000"]
# Disable gzip compression
  content_encoding = "identity"

# -- INPUT PLUGINS -- #
[[inputs.cpu]]
  percpu = true
  totalcpu = true
  collect_cpu_time = false
  report_active = false
[[inputs.mem]]
  # no customisation
Optionally, we recommend applying an aggregator plugin.
The InfluxDB Line Protocol default in many cases will lead to data in the form of multiple, fairly sparse rows.
QuestDB prefers rows that are "more dense".
To that end, the aggregator plugin takes all the metrics for the same tag - equivalent to a symbol - and the timestamp. It then outputs them into single row. If metrics are arriving in the usual ILP style with a metric per tag, the aggregator plugin will instead roll them into a more "dense" row as desired.
# -- AGGREGATOR PLUGINS ------------------------------------------------- #
# Merge metrics into multifield metrics by series key
[[aggregators.merge]]
  ## If true, the original metric will be dropped by the
  ## aggregator and will not get sent to the output plugins.
  drop_original = true
Run Telegraf and specify the configuration file with the QuestDB output:
telegraf --config questdb.conf
Telegraf should report the following if configured correctly:
2021-01-29T12:11:32Z I! Loaded inputs: cpu mem
2021-01-29T12:11:32Z I! Loaded aggregators:
2021-01-29T12:11:32Z I! Loaded processors:
2021-01-29T12:11:32Z I! Loaded outputs: influxdb_v2
...
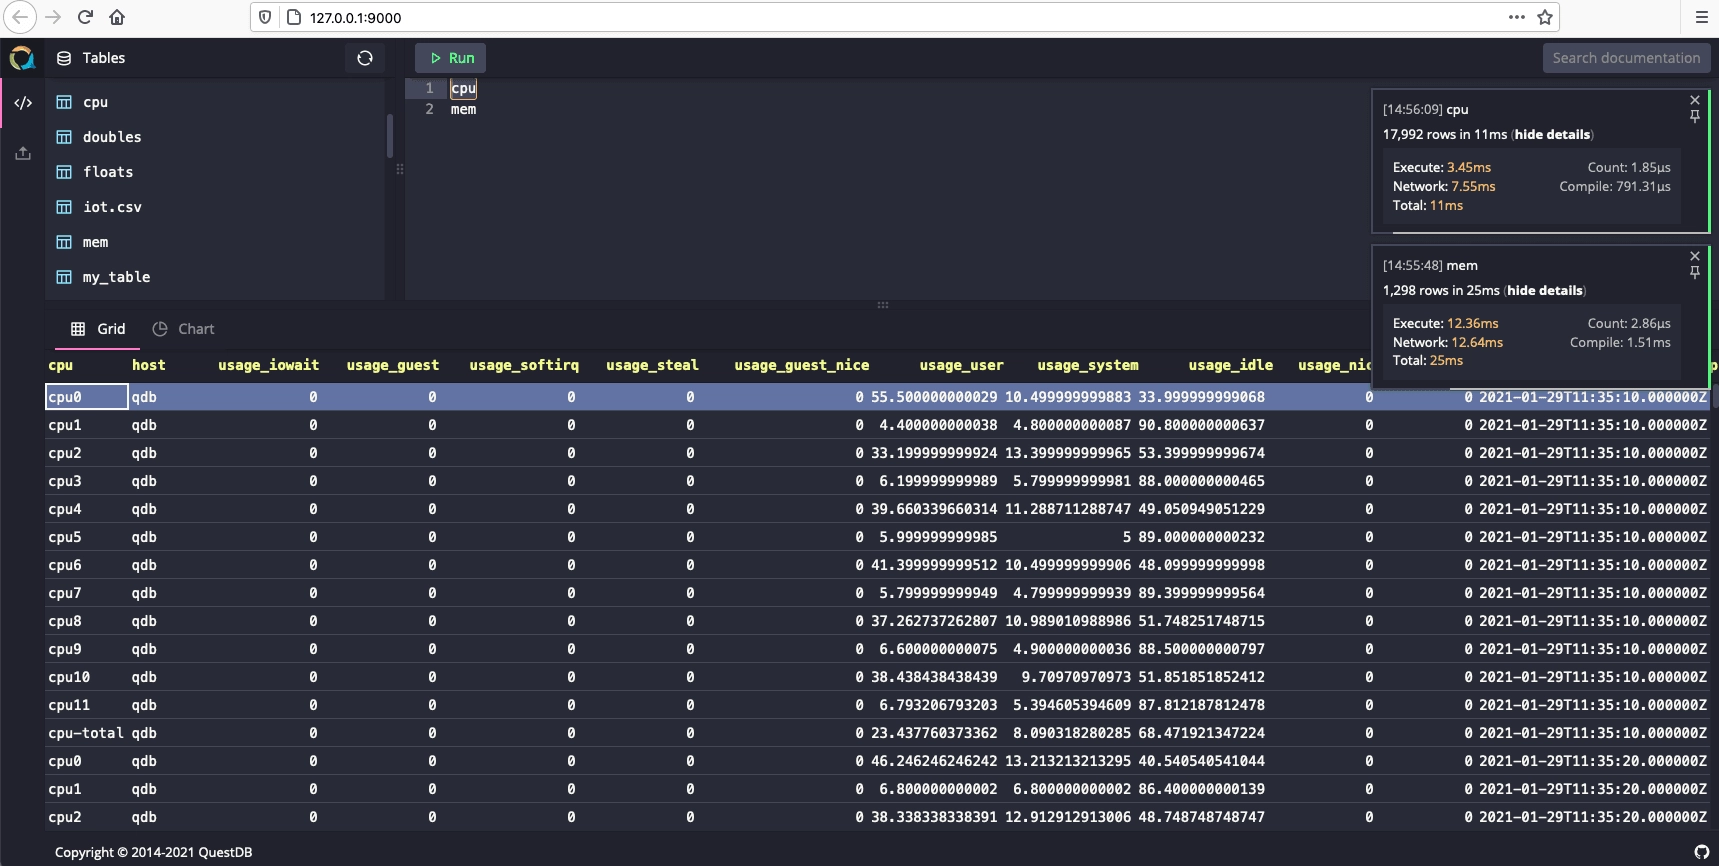
Verifying the integration
- Navigate to the QuestDB Web Console at
http://127.0.0.1:9000/. The Schema Navigator in the top left should display two new tables:
cpugenerated frominputs.cpumemgenerated frominputs.mem
- Type
cpuin the query editor and click RUN
The cpu table will have a column for each metric collected by the Telegraf
plugin for monitoring memory:
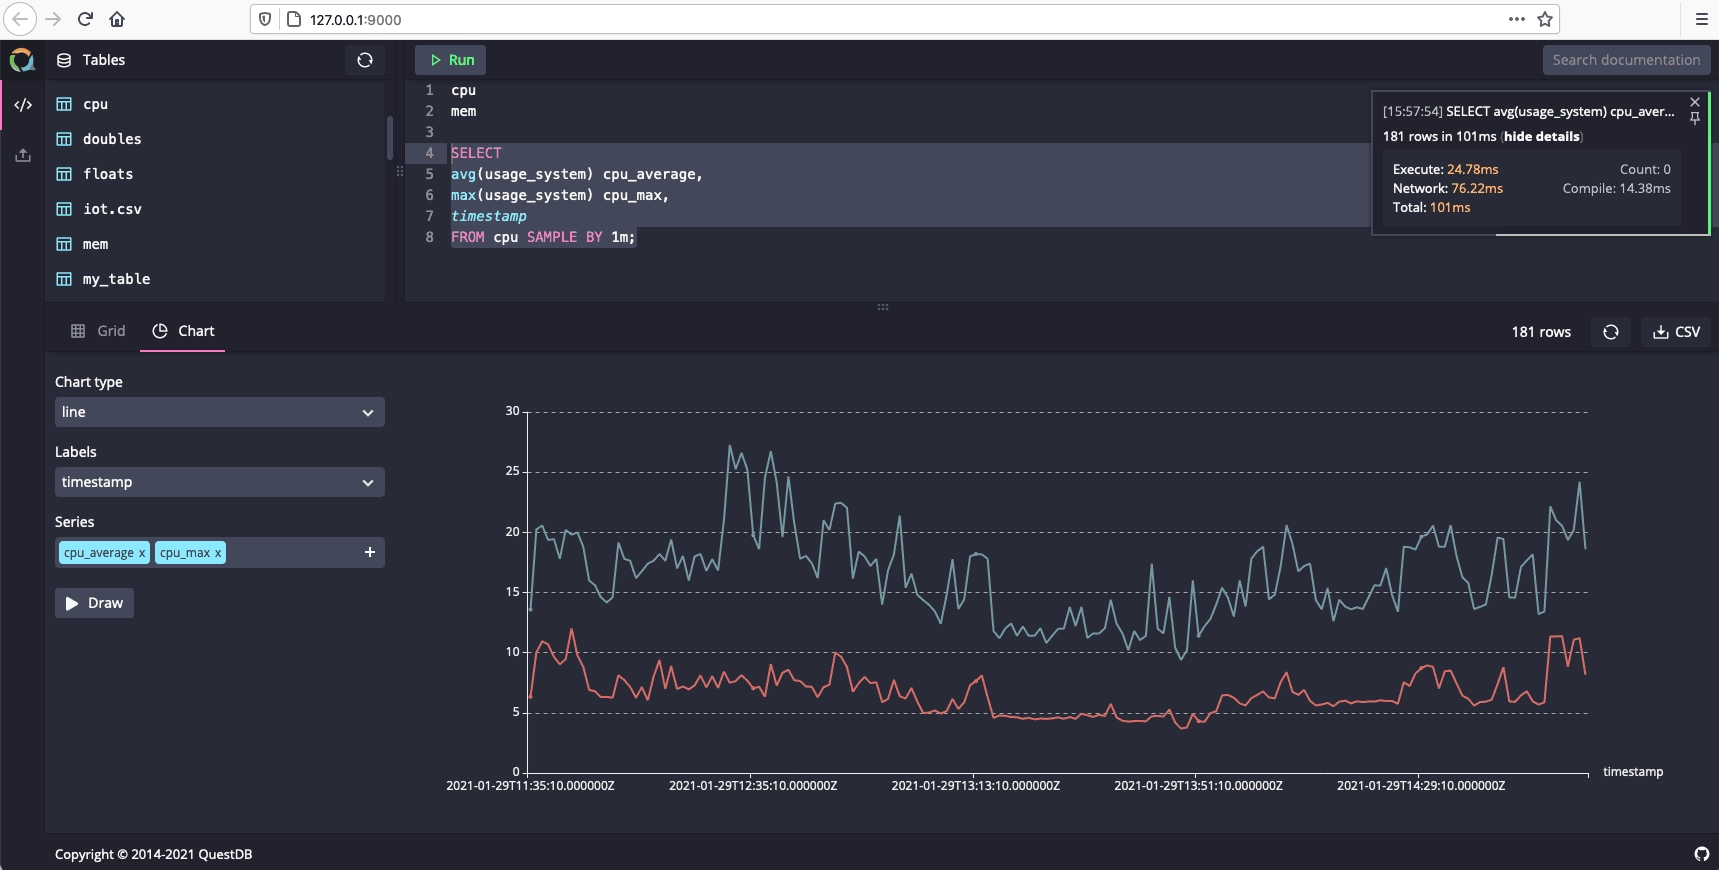
Graphing system CPU
To create a graph that visualizes CPU usage over time, run the following example query:
SELECT
avg(usage_system) cpu_average,
max(usage_system) cpu_max,
timestamp
FROM cpu SAMPLE BY 1m;
Select the Chart tab and set the following values:
- Chart type line
- Labels timestamp
- Series cpu_average and cpu_max