Prometheus monitoring and alerting
Prometheus is an open-source systems monitoring and alerting toolkit. Prometheus collects and stores metrics as time-series data, i.e. metrics information is stored with the timestamp at which it was recorded, alongside optional key-value pairs called labels.
Users can measure the internal status of a QuestDB instance via an HTTP endpoint
exposed by QuestDB at port 9003. This document describes how to enable metrics
via this endpoint, how to configure Prometheus to scrape metrics from a QuestDB
instance, and how to enable alerting from QuestDB to Prometheus Alertmanager.
Prerequisites
-
QuestDB must be running and accessible. Checkout the quick start.
-
Prometheus can be installed using homebrew, Docker, or directly as a binary. For more details, refer to the official Prometheus installation instructions.
-
Alertmanager can be run using Docker or Quay, or can be built from source by following the build instructions on GitHub.
Scraping Prometheus metrics from QuestDB
QuestDB has a /metrics HTTP endpoint on port 9003 to expose Prometheus
metrics. Before being able to query metrics, they must be enabled via the
metrics.enabled key in server configuration:
metrics.enabled=true
When running QuestDB via Docker, port 9003 must be exposed and the metrics
configuration can be enabled via the QDB_METRICS_ENABLED environment variable:
docker run \
-e QDB_METRICS_ENABLED=TRUE \
-p 8812:8812 -p 9000:9000 -p 9003:9003 -p 9009:9009 \
-v "$(pwd):/var/lib/questdb" \
questdb/questdb:8.2.1
To verify that metrics are being exposed correctly by QuestDB, navigate to
http://<questdb_ip>:9003/metrics in a browser, where <questdb_ip> is the IP
address of an instance, or execute a basic curl like the following example:
curl http://127.0.0.1:9003/metrics
# TYPE questdb_json_queries_total counter
questdb_json_queries_total 0

# TYPE questdb_memory_tag_MMAP_DEFAULT gauge
questdb_memory_tag_MMAP_DEFAULT 77872

# TYPE questdb_memory_malloc_count gauge
questdb_memory_malloc_count 659

# ...
To configure Prometheus to scrape these metrics, provide the QuestDB instance IP
and port 9003 as a target. The following example configuration file
questdb.yml assumes there is a running QuestDB instance on localhost
(127.0.0.1) with port 9003 available:
global:
  scrape_interval: 5s
  external_labels:
    monitor: 'questdb'

scrape_configs:
  - job_name: 'questdb'
    scrape_interval: 5s
    static_configs:
      - targets: ['127.0.0.1:9003']
Start Prometheus and pass this configuration on launch:
prometheus --config.file=questdb.yml
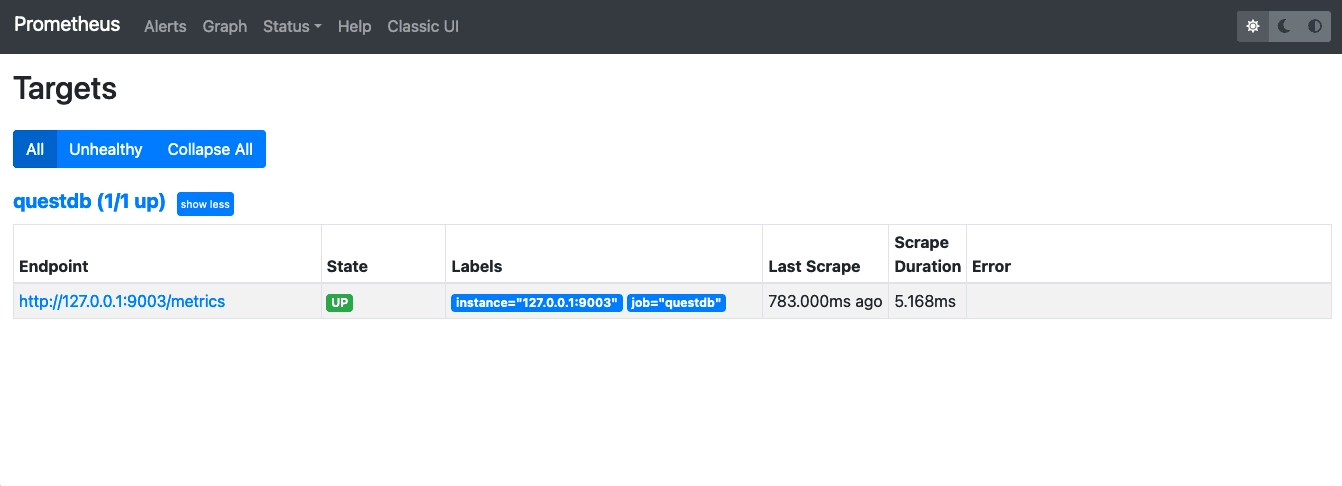
Prometheus should be available on 0.0.0.0:9090 and navigating to
http://0.0.0.0:9090/targets should show that QuestDB is being scraped
successfully:
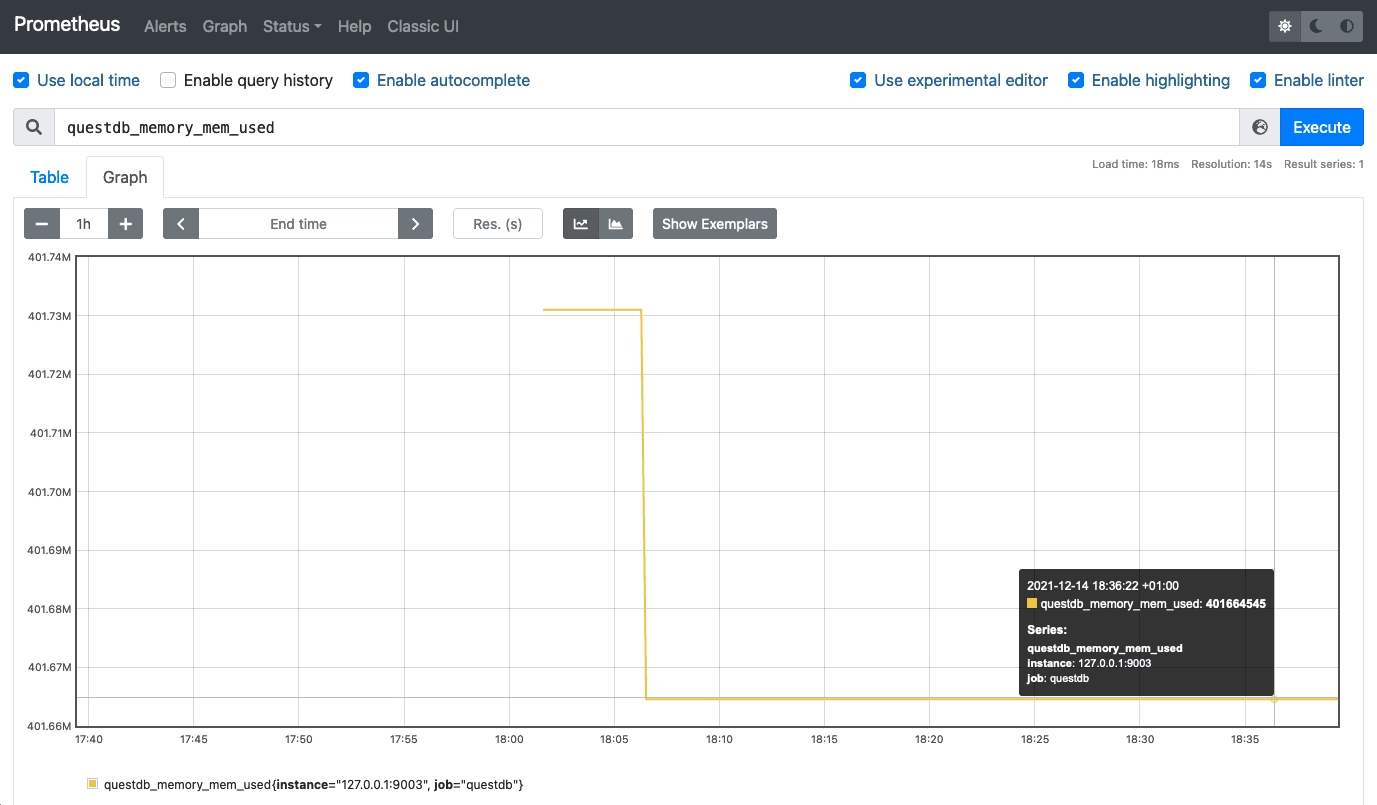
In the graphing tab of Prometheus (http://0.0.0.0:9090/graph), autocomplete
can be used to graph QuestDB-specific metrics which are all prefixed with
questdb_:
The following metrics are available:
| Metric | Type | Description |
|---|---|---|
questdb_commits_total | counter | Number of total commits of all types (in-order and out-of-order) executed on the database tables. |
questdb_o3_commits_total | counter | Number of total out-of-order (O3) commits executed on the database tables. |
questdb_committed_rows_total | counter | Number of total rows committed to the database tables. |
questdb_physically_written_rows_total | counter | Number of total rows physically written to disk. Greater than committed_rows with [out-of-order ingestion. Write amplification is questdb_physically_written_rows_total / questdb_committed_rows_total. |
questdb_rollbacks_total | counter | Number of total rollbacks executed on the database tables. |
questdb_json_queries_total | counter | Number of total REST API queries, including retries. |
questdb_json_queries_completed_total | counter | Number of successfully executed REST API queries. |
questdb_unhandled_errors_total | counter | Number of total unhandled errors occurred in the database. Such errors usually mean a critical service degradation in one of the database subsystems. |
questdb_jvm_major_gc_count_total | counter | Number of times major JVM garbage collection was triggered. |
questdb_jvm_major_gc_time_total | counter | Total time spent on major JVM garbage collection in milliseconds. |
questdb_jvm_minor_gc_count_total | counter | Number of times minor JVM garbage collection pause was triggered. |
questdb_jvm_minor_gc_time_total | counter | Total time spent on minor JVM garbage collection pauses in milliseconds. |
questdb_jvm_unknown_gc_count_total | counter | Number of times JVM garbage collection of unknown type was triggered. Non-zero values of this metric may be observed only on some, non-mainstream JVM implementations. |
questdb_jvm_unknown_gc_time_total | counter | Total time spent on JVM garbage collection of unknown type in milliseconds. Non-zero values of this metric may be observed only on some, non-mainstream JVM implementations. |
questdb_memory_tag_MMAP_DEFAULT | gauge | Amount of memory allocated for mmaped files. |
questdb_memory_tag_NATIVE_DEFAULT | gauge | Amount of allocated untagged native memory. |
questdb_memory_tag_MMAP_O3 | gauge | Amount of memory allocated for O3 mmapped files. |
questdb_memory_tag_NATIVE_O3 | gauge | Amount of memory allocated for O3. |
questdb_memory_tag_NATIVE_RECORD_CHAIN | gauge | Amount of memory allocated for SQL record chains. |
questdb_memory_tag_MMAP_TABLE_WRITER | gauge | Amount of memory allocated for table writer mmapped files. |
questdb_memory_tag_NATIVE_TREE_CHAIN | gauge | Amount of memory allocated for SQL tree chains. |
questdb_memory_tag_MMAP_TABLE_READER | gauge | Amount of memory allocated for table reader mmapped files. |
questdb_memory_tag_NATIVE_COMPACT_MAP | gauge | Amount of memory allocated for SQL compact maps. |
questdb_memory_tag_NATIVE_FAST_MAP | gauge | Amount of memory allocated for SQL fast maps. |
questdb_memory_tag_NATIVE_LONG_LIST | gauge | Amount of memory allocated for long lists. |
questdb_memory_tag_NATIVE_HTTP_CONN | gauge | Amount of memory allocated for HTTP connections. |
questdb_memory_tag_NATIVE_PGW_CONN | gauge | Amount of memory allocated for PostgreSQL Wire Protocol connections. |
questdb_memory_tag_MMAP_INDEX_READER | gauge | Amount of memory allocated for index reader mmapped files. |
questdb_memory_tag_MMAP_INDEX_WRITER | gauge | Amount of memory allocated for index writer mmapped files. |
questdb_memory_tag_MMAP_INDEX_SLIDER | gauge | Amount of memory allocated for indexed column view mmapped files. |
questdb_memory_tag_NATIVE_REPL | gauge | Amount of memory mapped for replication tasks. |
questdb_memory_free_count | gauge | Number of times native memory was freed. |
questdb_memory_mem_used | gauge | Current amount of allocated native memory. |
questdb_memory_malloc_count | gauge | Number of times native memory was allocated. |
questdb_memory_realloc_count | gauge | Number of times native memory was reallocated. |
questdb_memory_rss | gauge | Resident Set Size (Linux/Unix) / Working Set Size (Windows). |
questdb_memory_jvm_free | gauge | Current amount of free Java memory heap in bytes. |
questdb_memory_jvm_total | gauge | Current size of Java memory heap in bytes. |
questdb_memory_jvm_max | gauge | Maximum amount of Java heap memory that can be allocated in bytes. |
questdb_http_connections | gauge | Number of currently active HTTP connections. |
questdb_json_queries_cached | gauge | Number of current cached REST API queries. |
questdb_line_tcp_connections | gauge | Number of currently active InfluxDB Line Protocol TCP connections. |
questdb_pg_wire_connections | gauge | Number of currently active PostgreSQL Wire Protocol connections. |
questdb_pg_wire_select_queries_cached | gauge | Number of current cached PostgreSQL Wire Protocol SELECT queries. |
questdb_pg_wire_update_queries_cached | gauge | Number of current cached PostgreSQL Wire Protocol UPDATE queries. |
questdb_json_queries_cache_hits_total | counter | Number of total cache hits for JSON queries. |
questdb_json_queries_cache_misses_total | counter | Number of total cache misses for JSON queries. |
questdb_json_queries_completed_total | counter | Total number of completed JSON queries. |
questdb_jvm_major_gc_count_total | counter | Total number of major garbage collection events. |
questdb_jvm_major_gc_time_total | counter | Total time spent on major garbage collection. |
questdb_jvm_minor_gc_count_total | counter | Total number of minor garbage collection events. |
questdb_jvm_minor_gc_time_total | counter | Total time spent on minor garbage collection. |
questdb_jvm_unknown_gc_count_total | counter | Total number of unknown type garbage collection events. |
questdb_jvm_unknown_gc_time_total | counter | Total time spent on unknown type garbage collection. |
questdb_memory_tag_MMAP_BLOCK_WRITER | gauge | Amount of memory allocated for block writer mmapped files. |
questdb_memory_tag_MMAP_IMPORT | gauge | Amount of memory allocated for import operations. |
questdb_memory_tag_MMAP_PARALLEL_IMPORT | gauge | Amount of memory allocated for parallel import operations. |
questdb_memory_tag_MMAP_PARTITION_CONVERTER | gauge | Amount of memory allocated for partition converter operations. |
questdb_memory_tag_MMAP_SEQUENCER_METADATA | gauge | Amount of memory allocated for sequencer metadata. |
questdb_memory_tag_MMAP_TABLE_WAL_READER | gauge | Amount of memory allocated for table WAL reader mmapped files. |
questdb_memory_tag_MMAP_TABLE_WAL_WRITER | gauge | Amount of memory allocated for table WAL writer mmapped files. |
questdb_memory_tag_MMAP_TX_LOG | gauge | Amount of memory allocated for transaction log mmapped files. |
questdb_memory_tag_MMAP_TX_LOG_CURSOR | gauge | Amount of memory allocated for transaction log cursor mmapped files. |
questdb_memory_tag_MMAP_UPDATE | gauge | Amount of memory allocated for update operations. |
questdb_memory_tag_NATIVE_CB1 | gauge | Amount of memory allocated for native circular buffer 1. |
questdb_memory_tag_NATIVE_CB2 | gauge | Amount of memory allocated for native circular buffer 2. |
questdb_memory_tag_NATIVE_CB3 | gauge | Amount of memory allocated for native circular buffer 3. |
questdb_memory_tag_NATIVE_CB4 | gauge | Amount of memory allocated for native circular buffer 4. |
questdb_memory_tag_NATIVE_CB5 | gauge | Amount of memory allocated for native circular buffer 5. |
questdb_memory_tag_NATIVE_CIRCULAR_BUFFER | gauge | Amount of memory allocated for native circular buffers. |
questdb_memory_tag_NATIVE_DIRECT_BYTE_SINK | gauge | Amount of memory allocated for native direct byte sink. |
questdb_memory_tag_NATIVE_DIRECT_CHAR_SINK | gauge | Amount of memory allocated for native direct char sink. |
questdb_memory_tag_NATIVE_DIRECT_UTF8_SINK | gauge | Amount of memory allocated for native direct UTF-8 sink. |
questdb_memory_tag_NATIVE_FAST_MAP_INT_LIST | gauge | Amount of memory allocated for native fast map integer list. |
questdb_memory_tag_NATIVE_FUNC_RSS | gauge | Amount of memory allocated for native function RSS. |
questdb_memory_tag_NATIVE_GROUP_BY_FUNCTION | gauge | Amount of memory allocated for native group by function. |
questdb_memory_tag_NATIVE_ILP_RSS | gauge | Amount of memory allocated for native ILP RSS. |
questdb_memory_tag_NATIVE_IMPORT | gauge | Amount of memory allocated for native import operations. |
questdb_memory_tag_NATIVE_INDEX_READER | gauge | Amount of memory allocated for native index reader. |
questdb_memory_tag_NATIVE_IO_DISPATCHER_RSS | gauge | Amount of memory allocated for native IO dispatcher RSS. |
questdb_memory_tag_NATIVE_JIT | gauge | Amount of memory allocated for native JIT. |
questdb_memory_tag_NATIVE_JIT_LONG_LIST | gauge | Amount of memory allocated for native JIT long list. |
questdb_memory_tag_NATIVE_JOIN_MAP | gauge | Amount of memory allocated for native join map. |
questdb_memory_tag_NATIVE_LATEST_BY_LONG_LIST | gauge | Amount of memory allocated for native latest by long list. |
questdb_memory_tag_NATIVE_LOGGER | gauge | Amount of memory allocated for native logger. |
questdb_memory_tag_NATIVE_MIG | gauge | Amount of memory allocated for native MIG. |
questdb_memory_tag_NATIVE_MIG_MMAP | gauge | Amount of memory allocated for native MIG mmapped files. |
questdb_memory_tag_NATIVE_OFFLOAD | gauge | Amount of memory allocated for native offload. |
questdb_memory_tag_NATIVE_PARALLEL_IMPORT | gauge | Amount of memory allocated for native parallel import. |
questdb_memory_tag_NATIVE_PATH | gauge | Amount of memory allocated for native path. |
questdb_memory_tag_NATIVE_ROSTI | gauge | Amount of memory allocated for native rosti. |
questdb_memory_tag_NATIVE_SAMPLE_BY_LONG_LIST | gauge | Amount of memory allocated for native sample by long list. |
questdb_memory_tag_NATIVE_SQL_COMPILER | gauge | Amount of memory allocated for native SQL compiler. |
questdb_memory_tag_NATIVE_TABLE_READER | gauge | Amount of memory allocated for native table reader. |
questdb_memory_tag_NATIVE_TABLE_WAL_WRITER | gauge | Amount of memory allocated for native table WAL writer. |
questdb_memory_tag_NATIVE_TABLE_WRITER | gauge | Amount of memory allocated for native table writer. |
questdb_memory_tag_NATIVE_TEXT_PARSER_RSS | gauge | Amount of memory allocated for native text parser RSS. |
questdb_memory_tag_NATIVE_TLS_RSS | gauge | Amount of memory allocated for native TLS RSS. |
questdb_memory_tag_NATIVE_UNORDERED_MAP | gauge | Amount of memory allocated for native unordered map. |
questdb_pg_wire_errors_total | counter | Total number of errors in PostgreSQL wire protocol. |
questdb_pg_wire_select_cache_hits_total | counter | Total number of cache hits for PostgreSQL wire protocol select queries. |
questdb_pg_wire_select_cache_misses_total | counter | Total number of cache misses for PostgreSQL wire protocol select queries. |
questdb_wal_apply_physically_written_rows_total | counter | Total number of physically written rows during WAL apply. |
questdb_wal_apply_rows_per_second | gauge | Rate of rows applied per second during WAL apply. |
questdb_wal_apply_written_rows_total | counter | Total number of rows written during WAL apply. |
questdb_wal_written_rows_total | counter | Total number of rows written to WAL. |
questdb_workers_job_start_micros_max | gauge | Maximum time taken to start a worker job in microseconds. |
questdb_workers_job_start_micros_min | gauge | Minimum time taken to start a worker job in microseconds. |
All of the above metrics are volatile, i.e. they're collected since the current database start.
Configuring Prometheus Alertmanager
Full details on logging configurations can be found within the Logging & Metrics documentation.
QuestDB includes a log writer that sends any message logged at critical level
(by default) to Prometheus
Alertmanager over a
TCP/IP socket connection. To configure this writer, add it to the writers
config alongside other log writers.
Alertmanager may be started via Docker with the following command:
docker run -p 127.0.0.1:9093:9093 --name alertmanager quay.io/prometheus/alertmanager
To discover the IP address of this container, run the following command which
specifies alertmanager as the container name:
docker inspect -f '{{range.NetworkSettings.Networks}}{{.IPAddress}}{{end}}' alertmanager
To run QuestDB and point it towards Alertmanager for alerting, first create a
file ./conf/log.conf with the following contents. 172.17.0.2 in this case is
the IP address of the docker container for alertmanager that was discovered by
running the docker inspect command above.
# Which writers to enable
writers=stdout,alert

# stdout
w.stdout.class=io.questdb.log.LogConsoleWriter
w.stdout.level=INFO

# Prometheus Alerting
w.alert.class=io.questdb.log.LogAlertSocketWriter
w.alert.level=CRITICAL
w.alert.alertTargets=172.17.0.2:9093
Start up QuestDB in Docker using the following command:
docker run \
  -p 9000:9000 -p 8812:8812 -p 9009:9009 -p 9003:9003 \
  -v "$(pwd)::/var/lib/questdb" \
  questdb/questdb:6.1.3
When alerts are successfully triggered, QuestDB logs will indicate the sent and received status:
2021-12-14T18:42:54.222967Z I i.q.l.LogAlertSocketWriter Sending: 2021-12-14T18:42:54.122874Z I i.q.l.LogAlertSocketWriter Sending: 2021-12-14T18:42:54.073978Z I i.q.l.LogAlertSocketWriter Received [0] 172.17.0.2:9093: {"status":"success"}
2021-12-14T18:42:54.223377Z I i.q.l.LogAlertSocketWriter Received [0] 172.17.0.2:9093: {"status":"success"}