QuestDB
Product
Learn
Pricing
Docs
Search
7.4.2
Roadmap
Login
Get QuestDB
Popular topics
Benchmarks
Tutorials
Demos
User Stories
SQL
GRAFANA
MARKET DATA
PYTHON
KAFKA
IoT
TELEGRAF
RELEASE
ENGINEERING
PROMETHEUS
K8S
PANDAS
Blog Posts
PERFORMANCE
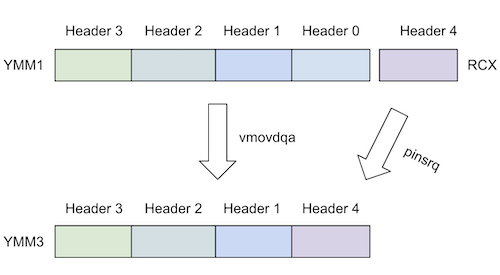
Does "vpmovzxbd" Scare You? Here's Why it Doesn't Have To
by
Marko Topolnik
on April 12, 2024
TUTORIAL
Create an ADS-B flight radar with QuestDB and a Raspberry Pi
by
Nic Hourcard
on April 8, 2024
TUTORIAL
Build a temperature IoT sensor with Raspberry Pi Pico & QuestDB
by
Nic Hourcard
on April 5, 2024
TUTORIAL
Create an IoT server with QuestDB and a Raspberry Pi
by
Nic Hourcard
on April 4, 2024
BENCHMARK
TimescaleDB vs. QuestDB: Performance benchmarks and overview
by
Nic Hourcard
on March 27, 2024
TUTORIAL
Maximize your SQL efficiency: SELECT best practices
by
Javier Ramirez
on March 11, 2024
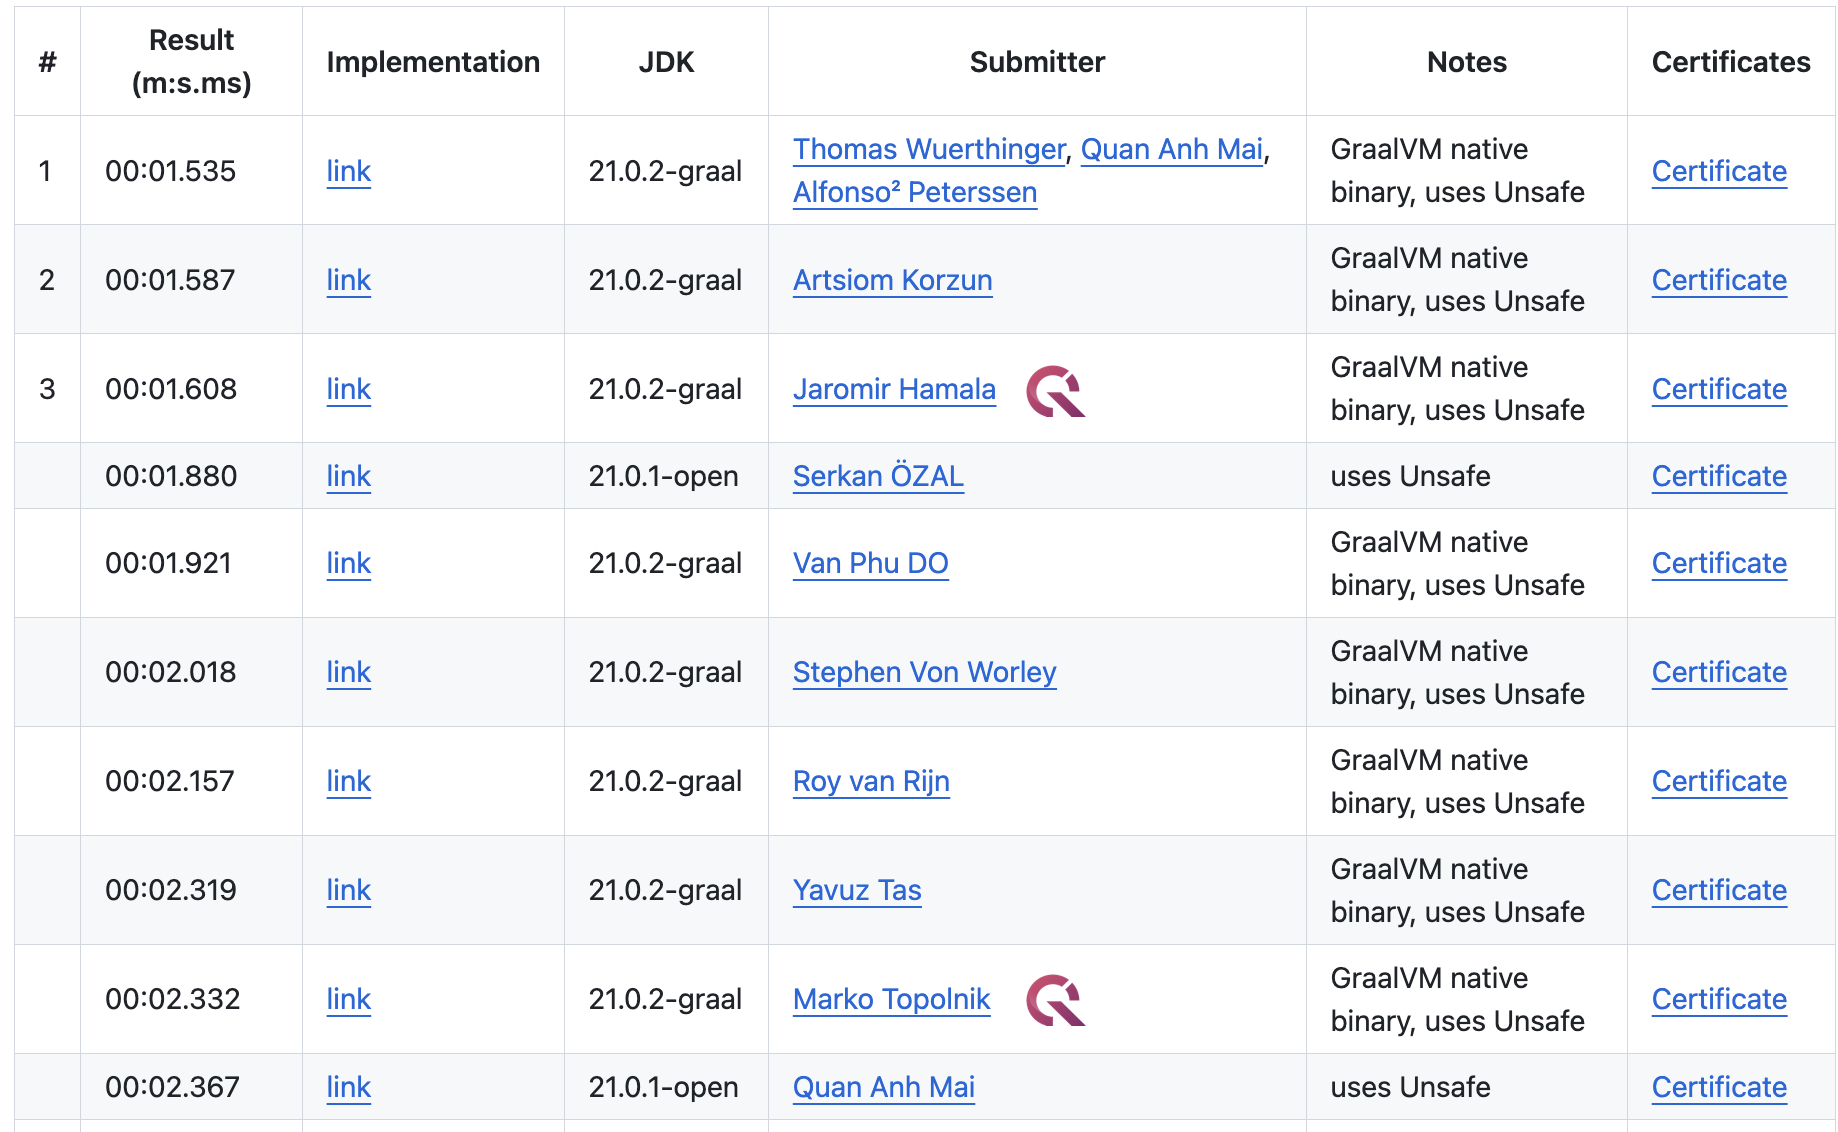
1BRC
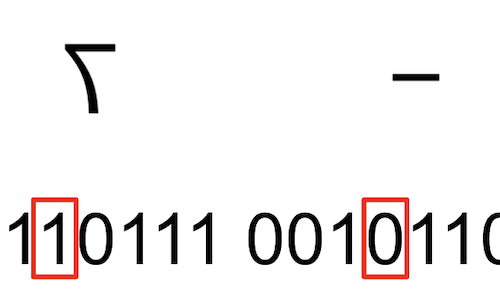
1BRC merykitty’s Magic SWAR: 8 Lines of Code Explained in 3,000 Words
by
Marko Topolnik
on March 7, 2024
BENCHMARK
Benchmark and comparison: QuestDB vs. InfluxDB
by
Andrey Pechkurov
on February 26, 2024
1BRC
The Billion Row Challenge (1BRC) - Step-by-step from 71s to 1.7s
by
Marko Topolnik
on February 20, 2024
TUTORIAL
Replace InfluxDB with QuestDB
by
Alex Pelagenko
on February 1, 2024
TUTORIAL
How crypto exchanges like Coinbase make money
by
Nic Hourcard
on January 29, 2024
TUTORIAL
Tracking sea faring ships with AIS data and Grafana
by
Nic Hourcard
on January 24, 2024
TUTORIAL
US Bitcoin ETFs: Understanding fair value
by
Nic Hourcard
on January 16, 2024
GRAFANA
Visualizing real-time NYC cab data and geodata
by
Nic Hourcard
on January 15, 2024
GRAFANA
Visualizing yield curves with Grafana and QuestDB
by
Nic Hourcard
on January 12, 2024
VIEW ON QUESTDB.IO
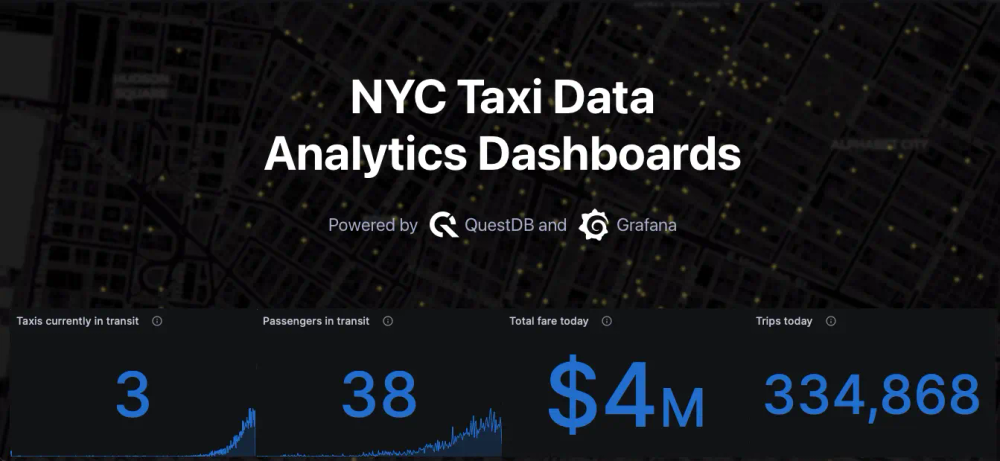
DEMO
NYC Taxi Data Analytics Dashboards
by
QuestDB
on January 9, 2024
GRAFANA
Normalizing Grafana charts with window functions
by
Yitaek Hwang
on January 9, 2024
GRAFANA
How to increase Grafana refresh rate frequency
by
Nic Hourcard
on January 8, 2024
ENGINEERING
OLAP vs Time-Series Databases: The SQL Perspective
by
Javier Ramirez
on December 21, 2023
TUTORIAL
Tracking correlations across financial market assets
by
Nic Hourcard
on December 14, 2023
VIEW ON QUESTDB.IO
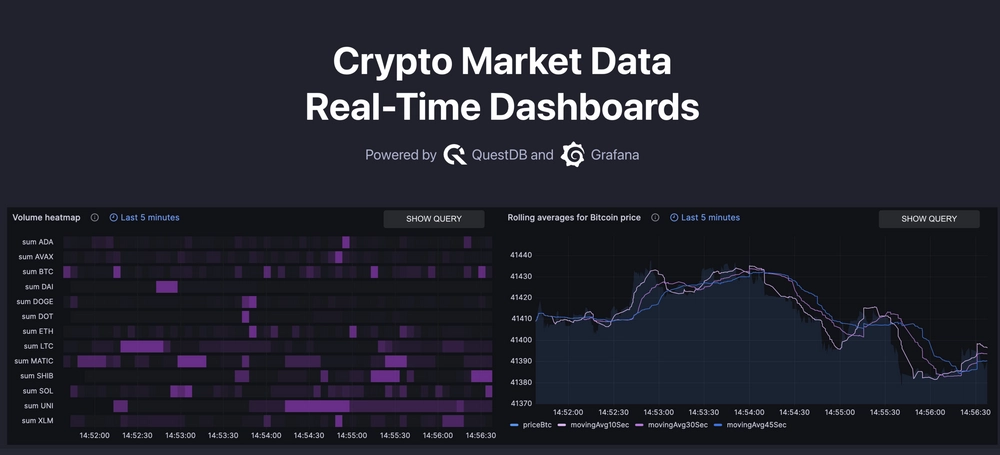
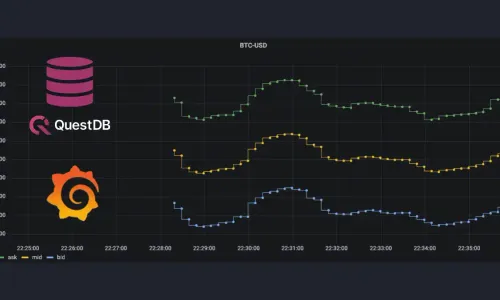
DEMO
Crypto Market Data Real-Time Dashboards
by
QuestDB
on December 13, 2023
TUTORIAL
Build your own custom trading dashboard
by
Nic Hourcard
on December 12, 2023
TUTORIAL
Managing large lists of symbols with Grafana variables and QuestDB
by
Nic Hourcard
on December 11, 2023
TUTORIAL
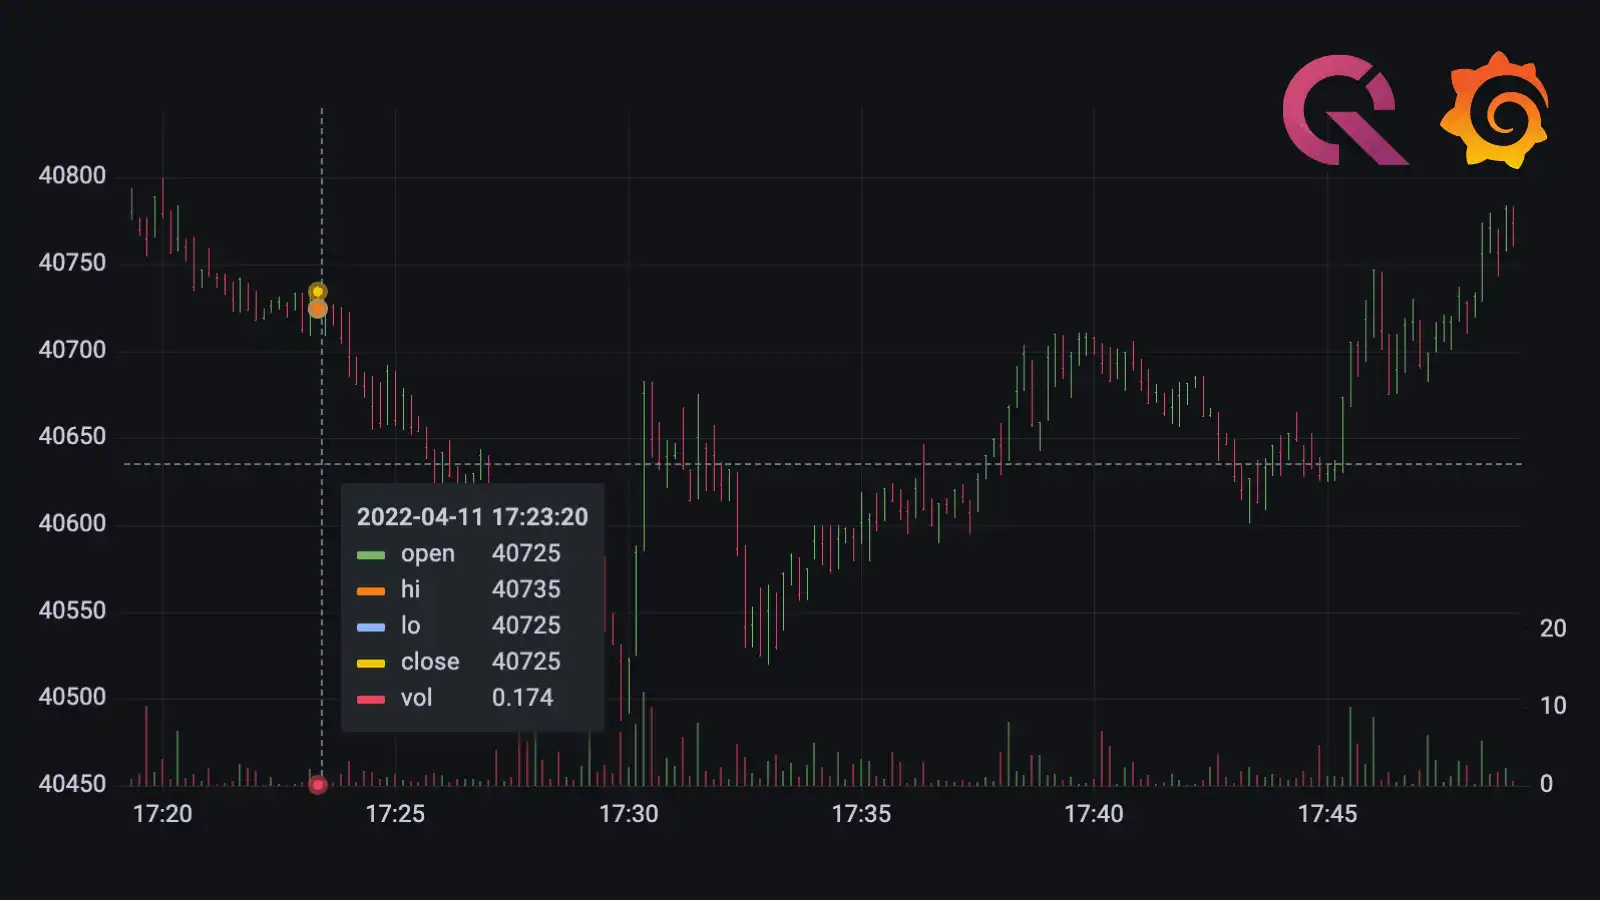
Moving average signals with QuestDB, Grafana and Coinbase
by
Nic Hourcard
on December 8, 2023
RELEASE
QuestDB Release Week #4
by
QuestDB Team
on November 24, 2023
ENGINEERING
Building a faster hash table for high performance SQL joins
by
Andrey Pechkurov
on November 23, 2023
TIME SERIES
What is time series data?
by
Nic Hourcard
on November 21, 2023
ENGINEERING
Solving duplicate data with performant deduplication
by
Javier Ramirez
on November 16, 2023
COMMUNITY
QuestDB + Hacktoberfest 2023: 10 Years of Hacking
by
QuestDB Team
on October 3, 2023
TUTORIAL
Time-series IoT tracker using QuestDB, Node.js, and Grafana
by
Yitaek Hwang
on September 20, 2023
QUESTDB
Our Website Source Is Now Private, A Cautionary Tale
by
Nic Hourcard
on September 1, 2023
ENGINEERING
Leveraging Rust in our high-performance Java database
by
Adam Cimarosti
on August 29, 2023
ENGINEERING
Navigating Access Control Design: Pursuing Clarity and Simplicity
by
Imre Aranyosi
on August 22, 2023
TUTORIAL
QuestDB Enterprise: Role-based Access Control Walkthrough
by
QuestDB Team
on August 18, 2023
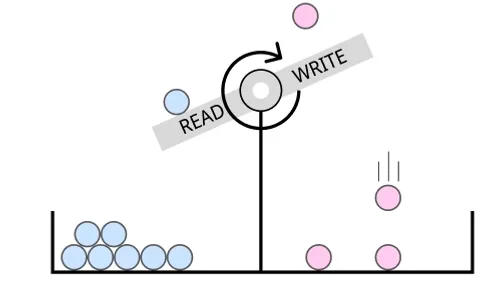
ENGINEERING
Concurrent Data Structure Design Walkthrough
by
Jaromir Hamala
on August 17, 2023
ENGINEERING
Fuzz Testing Is the Best Thing To Happen to Our Application Tests
by
Andrey Pechkurov
on August 16, 2023
ENGINEERING
We moved our Cloud operations to a Kubernetes Operator
by
Steve Sklar
on August 15, 2023
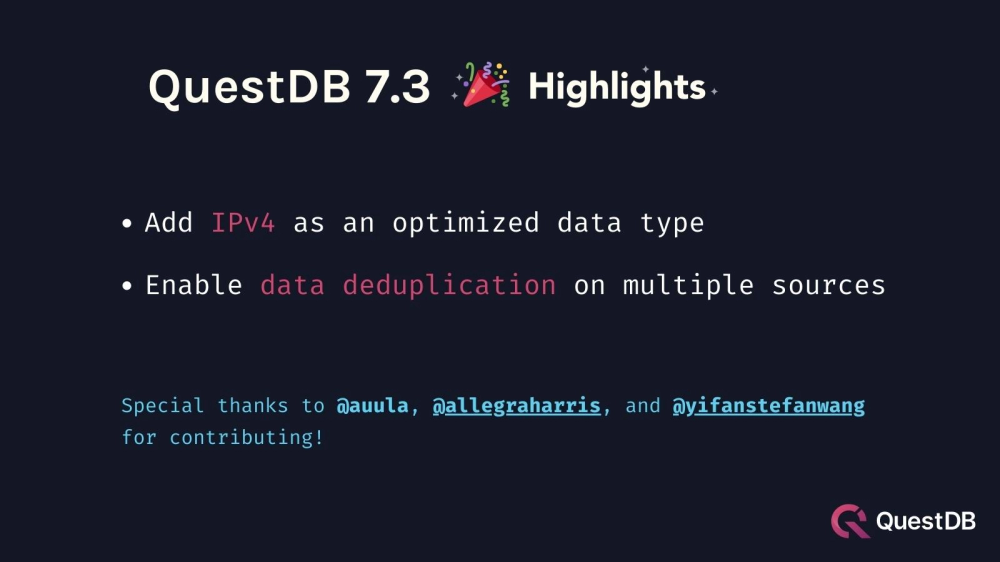
RELEASE
QuestDB 7.3 Release: Deduplication and IPv4 Support
by
QuestDB
on August 7, 2023
TUTORIAL
Visualizing IoT Data with MQTT, QuestDB, and Grafana
by
Gábor Boros
on July 6, 2023
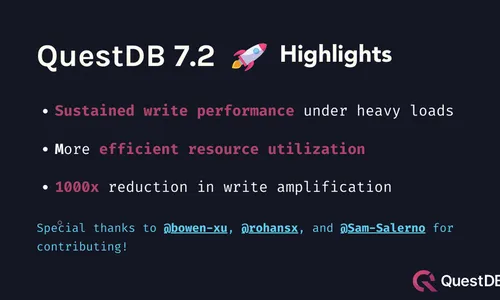
RELEASE
QuestDB 7.2 Release
by
QuestDB
on June 12, 2023
ENGINEERING
Max Open Files Limit on MacOS for the JVM
by
Imre Aranyosi
on June 8, 2023
TUTORIAL
Getting Started with QuestDB Cloud
by
Steve Sklar
on June 1, 2023
TUTORIAL
Exploring Financial Tick Data with Jupyter Notebook and Pandas
by
Yitaek Hwang
on May 22, 2023
TUTORIAL
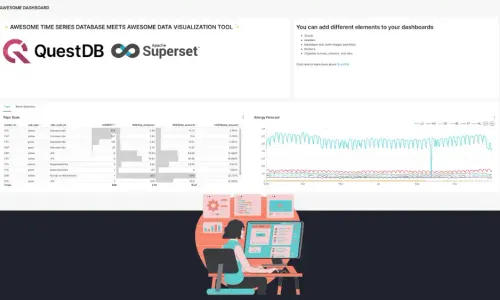
Time-Series Data Visualization with Apache Superset and QuestDB
by
Javier Ramirez
on May 19, 2023
BENCHMARK
Optimizing the Optimizer: the Time-Series Benchmark Suite
by
Andrey Pechkurov
on May 18, 2023
ENGINEERING
Investigating Linux Phantom Disk Reads
by
Andrey Pechkurov
on May 2, 2023
SQL
Exploring Query Plan Scan Nodes with SQL EXPLAIN
by
Bolek Ziobrowski
on April 25, 2023
MARKET DATA
Ingesting Financial Tick Data Using a Time-Series Database
by
Yitaek Hwang
on April 18, 2023
TUTORIAL
Time-Series Monitoring Dashboard with Grafana and QuestDB
by
QuestDB
on April 12, 2023
TUTORIAL
Integrate Apache Spark and QuestDB for Time-Series Analytics
by
Imre Aranyosi
on April 6, 2023
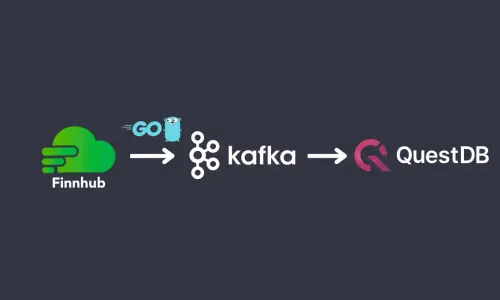
TUTORIAL
Processing Time-Series Data with QuestDB and Apache Kafka
by
Yitaek Hwang
on March 31, 2023
ENGINEERING
The Inner Workings of Distributed Databases
by
Alex Pelagenko
on March 28, 2023
VIEW ON ITNEXT.IO
TIME-SERIES
Migrating from Relational Databases to Time-series Databases
by
Yitaek Hwang
on March 24, 2023
BENCHMARK
MongoDB Time Series Benchmark and Review
by
QuestDB
on March 20, 2023
TUTORIAL
Loading Pandas DataFrames into QuestDB
by
Gábor Boros
on March 9, 2023
ENGINEERING
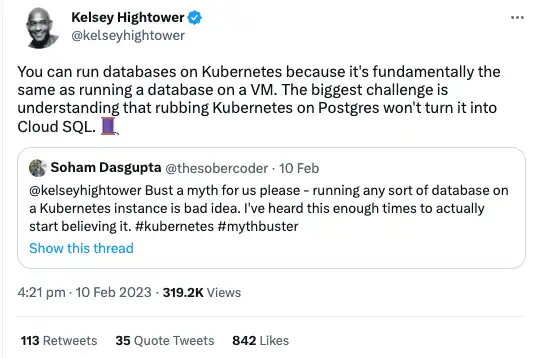
Running Databases on Kubernetes
by
Steve Sklar
on March 2, 2023
ENGINEERING
The Tale of Troubleshooting: Unstable Builds and Open Source Infrastructure
by
Jaromir Hamala
on March 1, 2023
VIEW ON GITHUB.COM
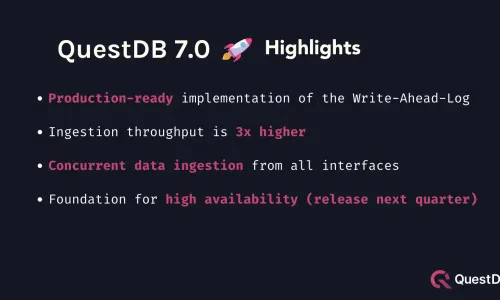
RELEASE
QuestDB 7.0 Release
by
QuestDB
on February 28, 2023
VIEW ON PLAY.QUESTDB.IO
DEMO
QuestDB with Python, Pandas, and SQL in a Jupyter notebook
by
QuestDB
on February 22, 2023
ENGINEERING
UUID: Coordination-Free Unique Keys and Why They are Useful
by
Jaromir Hamala
on February 10, 2023
ETL
Data Integration for Time-Series: ETL, ELT, and CDC
by
Yitaek Hwang
on February 6, 2023
SQL
EXPLAIN Your SQL Query Plan
by
Bolek Ziobrowski
on January 26, 2023
TUTORIAL
Three SQL Keywords for Finding Missing Data
by
Kovid Rathee
on January 24, 2023
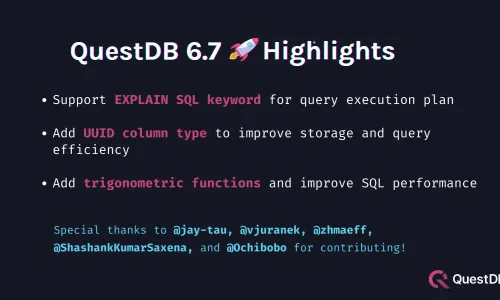
RELEASE
QuestDB 6.7 Release
by
QuestDB
on January 23, 2023
KUBERNETES
Using QuestDB to collect infrastructure metrics
by
Steve Sklar
on January 19, 2023
TUTORIAL
Realtime crypto tracker with QuestDB Kafka Connector
by
Yitaek Hwang
on January 12, 2023
TUTORIAL
Change Data Capture with QuestDB and Debezium
by
Yitaek Hwang
on January 3, 2023
KUBERNETES
Using Prometheus, Loki, and Grafana to monitor QuestDB in Kubernetes
by
Steve Sklar
on December 13, 2022
PERFORMANCE
Listen to Your CPU - Full-table Scans Are Fast
by
Jaromir Hamala
on November 30, 2022
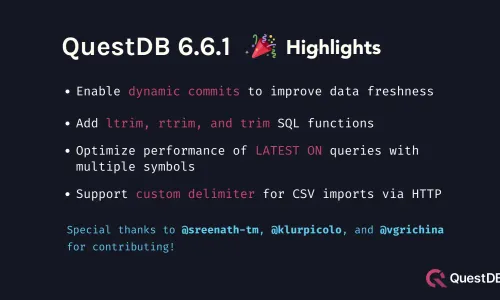
TIME-SERIES
QuestDB 6.6.1 - Dynamic Commits
by
Vlad Ilyushchenko
on November 25, 2022
TUTORIAL
SQL Extensions for Time Series Data in QuestDB - Part II
by
Kovid Rathee
on November 23, 2022
COMMUNITY
QuestDB at Devoxx Belgium 2022
by
Amy Wang
on November 8, 2022
TUTORIAL
Data Lifecycle with QuestDB
by
Yitaek Hwang
on November 2, 2022
COMMUNITY
QuestDB at Big Data LDN 2022
by
Javier Ramirez
on October 20, 2022
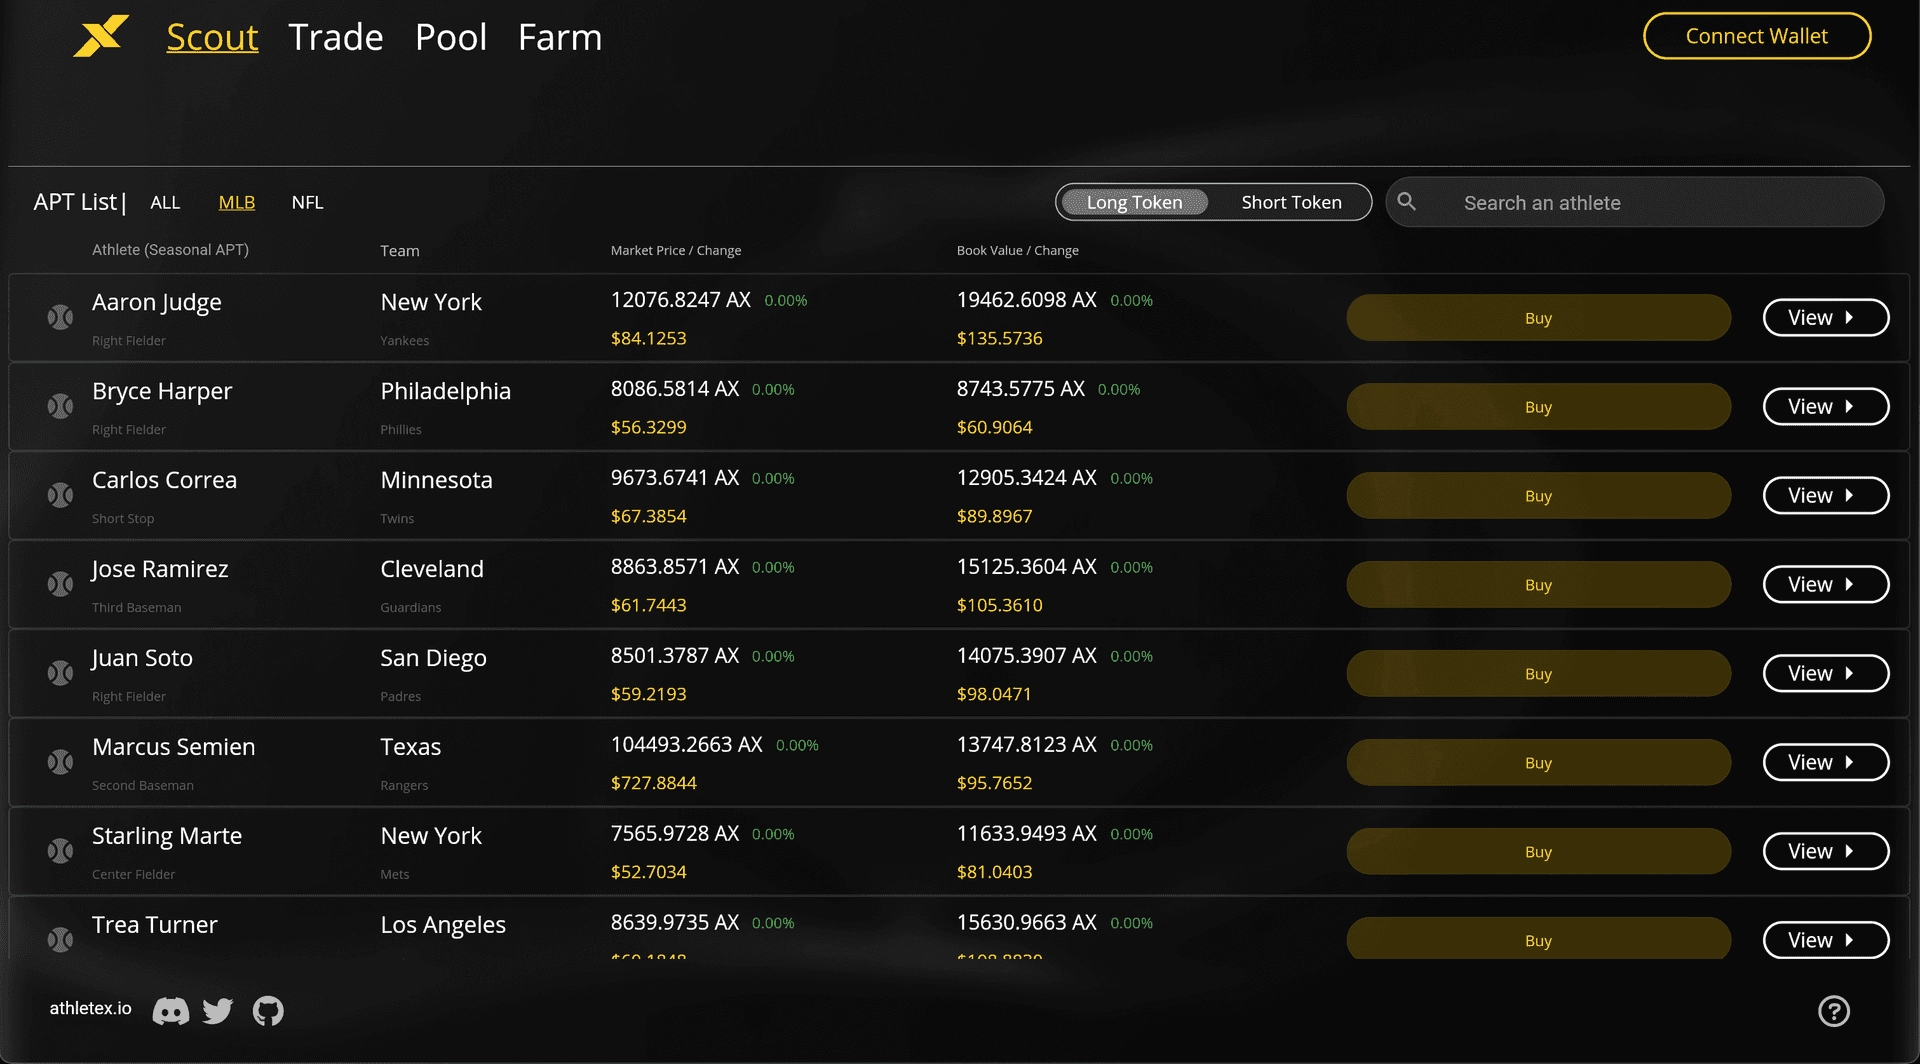
MARKET DATA
DevStories #1: Time-series for sports prediction markets
by
Pei-Shan Wu
on October 3, 2022
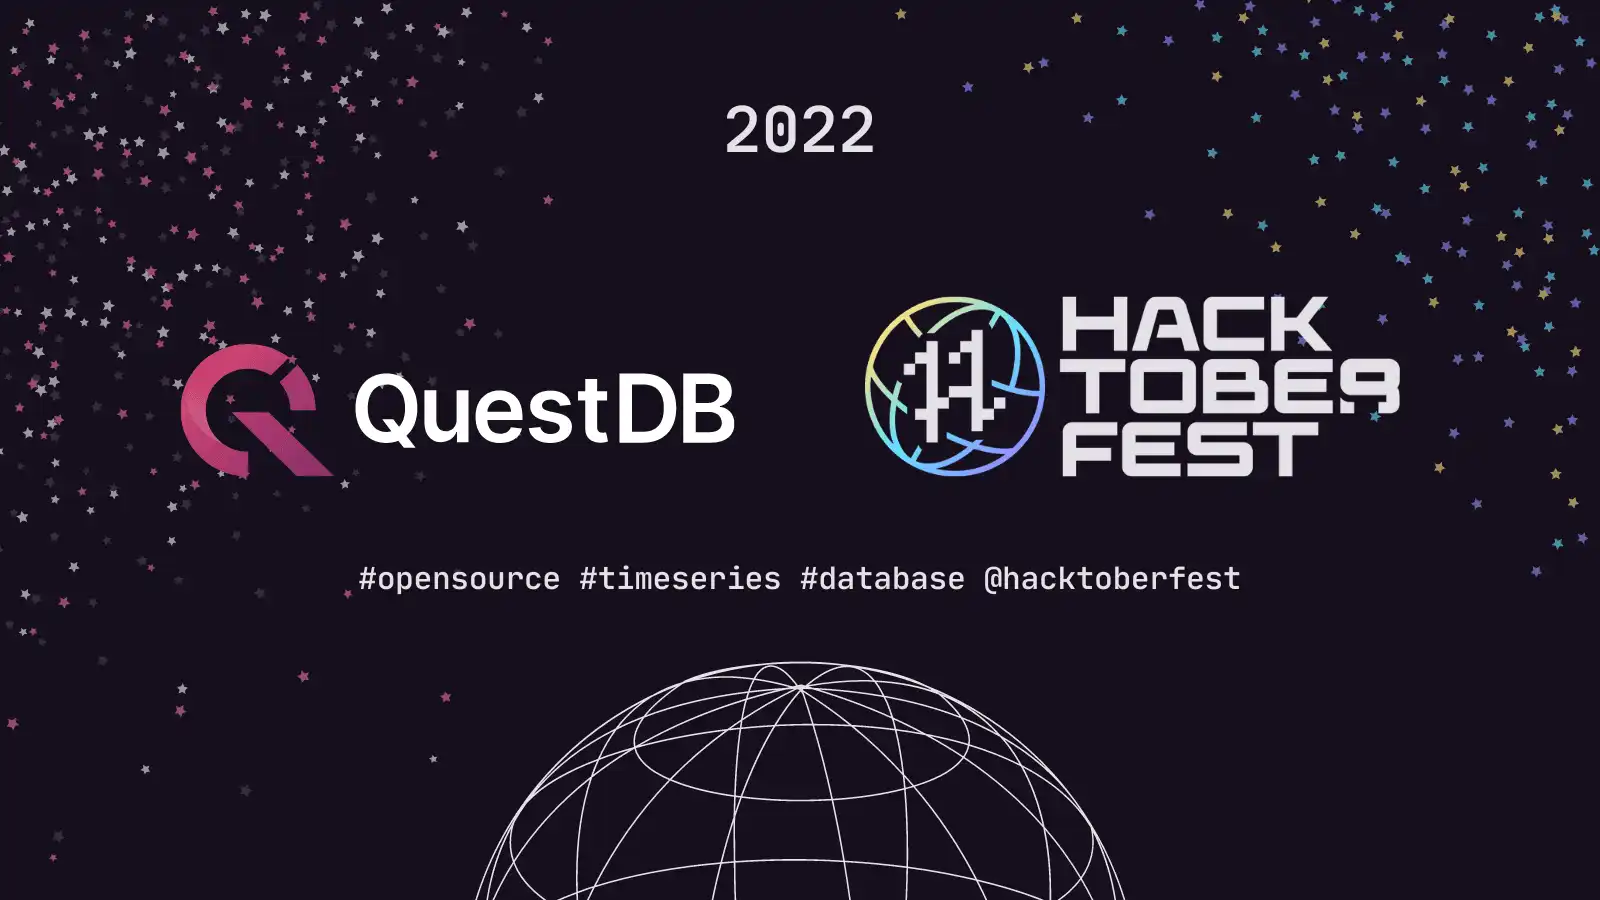
COMMUNITY
Join Hacktoberfest 2022 and contribute to QuestDB!
by
Pei-Shan Wu
on September 30, 2022
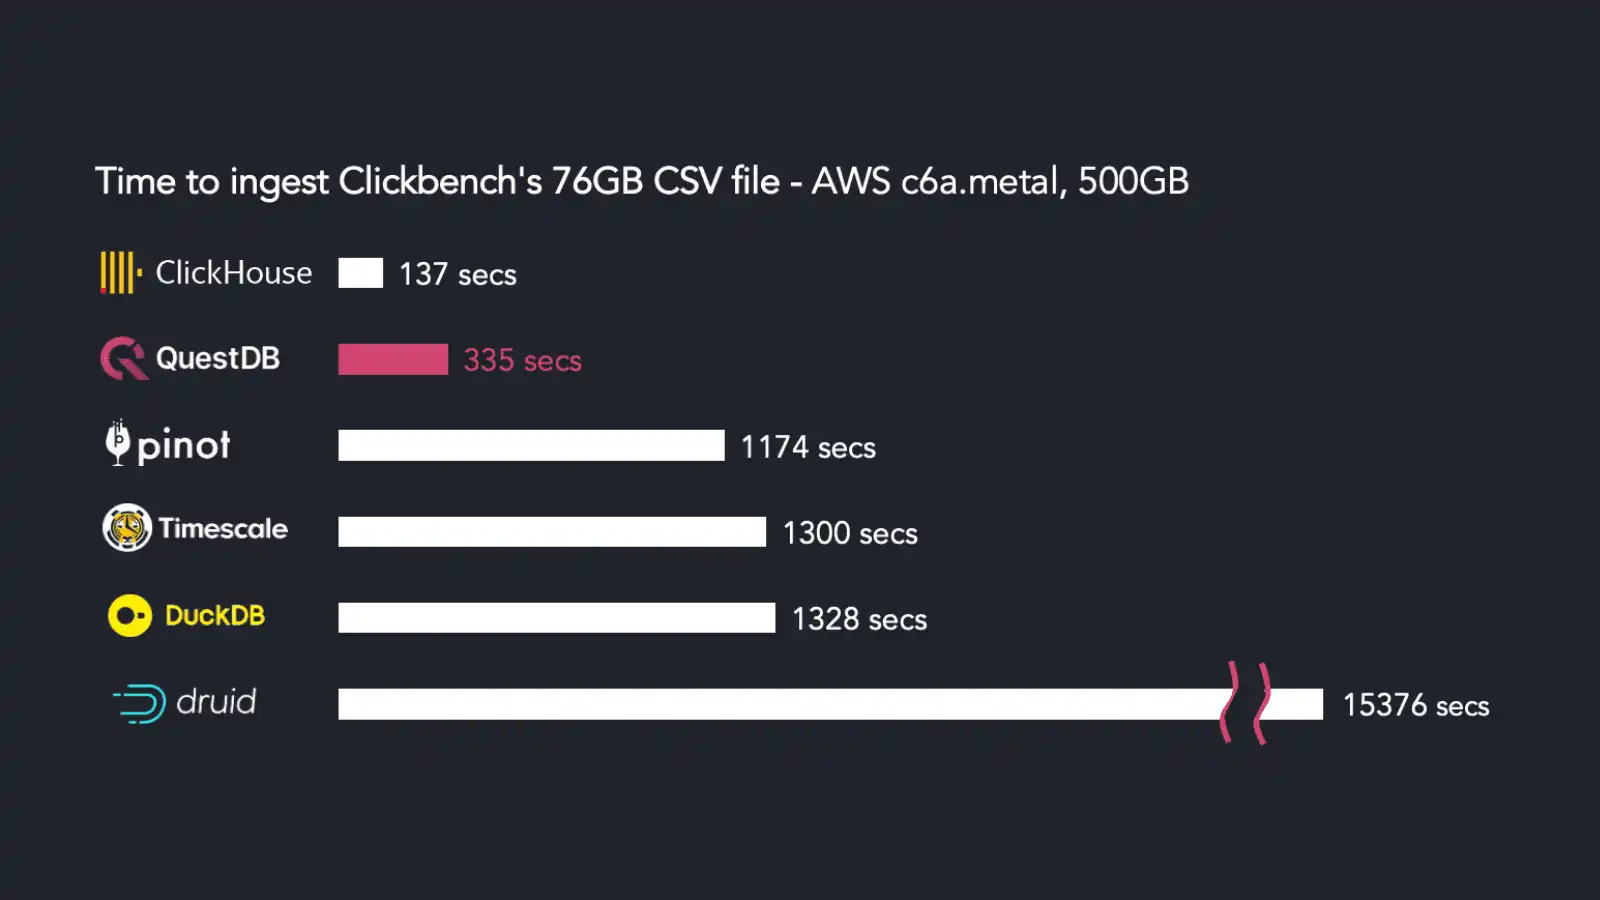
BENCHMARK
Importing 300k rows/sec with io_uring
by
Andrey Pechkurov
on September 12, 2022
VIEW ON GITHUB.COM
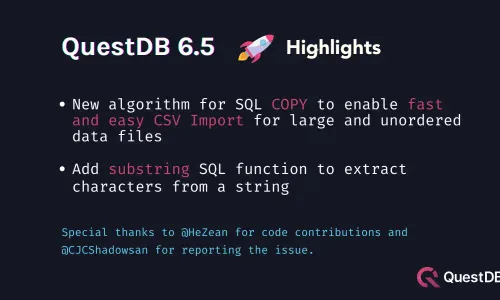
RELEASE
QuestDB 6.5 Release - CSV import
by
Pei-Shan Wu
on August 8, 2022
TUTORIAL
Setting up Basic Authentication for QuestDB open source using Nginx
by
Kovid Rathee
on August 5, 2022
PYTHON
Time Series Forecasting with TensorFlow and QuestDB
by
Gourav Singh Bais
on June 20, 2022
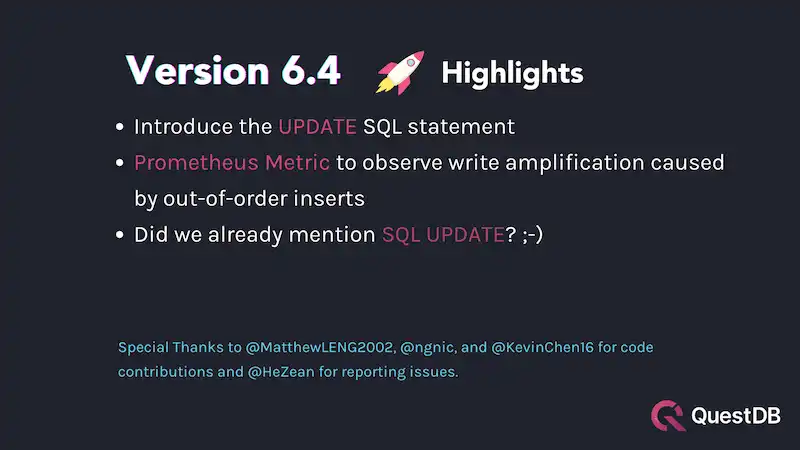
RELEASE
QuestDB 6.4 Release Highlights
by
Jaromir Hamala
on May 31, 2022
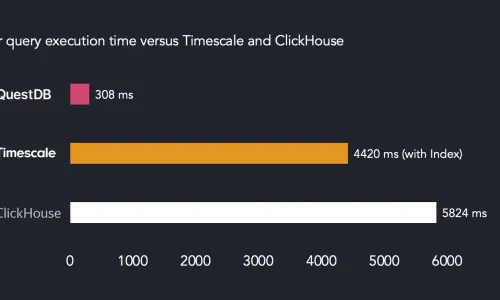
BENCHMARK
4Bn rows/sec query benchmark: Clickhouse vs QuestDB vs Timescale
by
Andrey Pechkurov
on May 26, 2022
VIEW ON REDPANDA.COM
TUTORIAL
How to build a real-time crypto tracker with Redpanda and QuestDB
by
Yitaek Hwang
on May 25, 2022
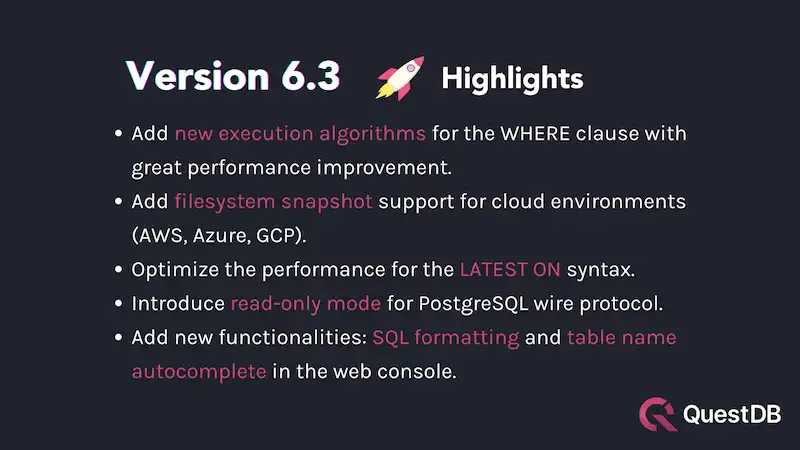
RELEASE
QuestDB 6.3 Release Highlights
by
Miguel Arregui
on May 9, 2022
TUTORIAL
Time Series Data Analytics with QuestDB and Cube.js
by
Andrey Pechkurov
on April 26, 2022
VIEW ON MINDSDB.COM
TUTORIAL
Enabling Machine Learning in QuestDB with MindsDB
by
Jorge Torres,
on April 18, 2022
DEMO
Demo of live crypto data streamed with QuestDB and Grafana
by
Nicolas Hourcard
on April 12, 2022
TUTORIAL
Crypto Volume Profiles with QuestDB and Julia
by
Dean Markwick
on March 29, 2022
TUTORIAL
Crypto Data Visualization Dashboards with Grafana
by
Tancrede Collard
on March 15, 2022
TUTORIAL
How to generate time-series data in QuestDB
by
Gábor Boros
on March 14, 2022
COMPANY
Calling on our community members to help us support Ukraine
by
Nicolas Hourcard
on March 7, 2022
VIEW ON DM13450.GITHUB.IO
TUTORIAL
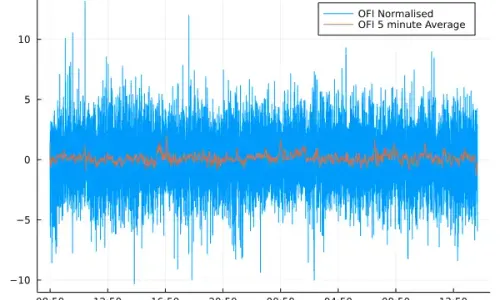
Order Flow Imbalance - A High Frequency Trading Signal
by
Dean Markwick
on February 2, 2022
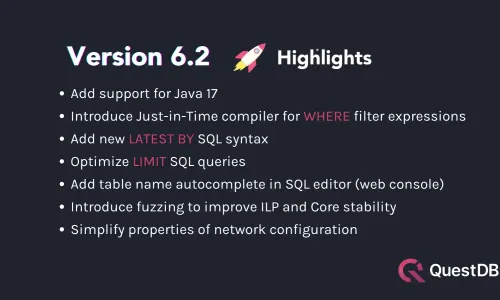
RELEASE
QuestDB 6.2 January release, SQL JIT compiler
by
Andrey Pechkurov
on January 27, 2022
ENGINEERING
How we built a SIMD JIT compiler for SQL in QuestDB
by
Andrey Pechkurov
on January 12, 2022
COMPANY
Our two-year journey to raise $15m in venture capital
by
Nicolas Hourcard
on January 3, 2022
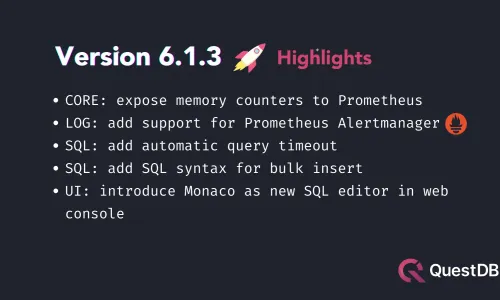
RELEASE
QuestDB 6.1.3 December release, Prometheus improvements
by
Brian Smith
on December 20, 2021
TUTORIAL
Analyzing Financial Time-Series Data via the Julia Language and QuestDB
by
Dean Markwick
on November 22, 2021
COMPANY
Why I joined QuestDB as a core database engineer
by
Miguel Arregui
on November 9, 2021
ENGINEERING
How we built inter-thread messaging from scratch
by
Vlad Ilyushchenko
on November 3, 2021
TUTORIAL
Real-time stock price dashboard using QuestDB, Python and Plotly
by
Gábor Boros
on November 1, 2021
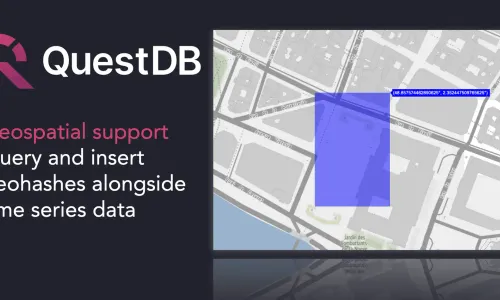
DEMO
Demo geospatial and timeseries queries on 250k unique devices
by
Vlad Ilyushchenko
on October 4, 2021
COMMUNITY
Join Hacktoberfest 2021 and contribute to QuestDB!
by
Pei-Shan Wu
on October 1, 2021
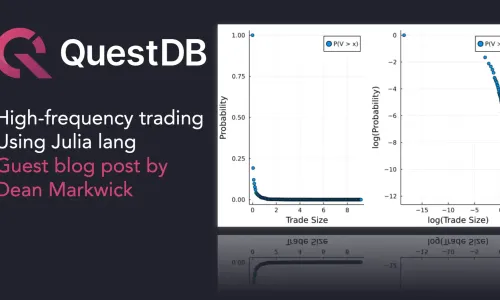
TUTORIAL
High frequency finance with Julia and QuestDB
by
Dean Markwick
on September 17, 2021
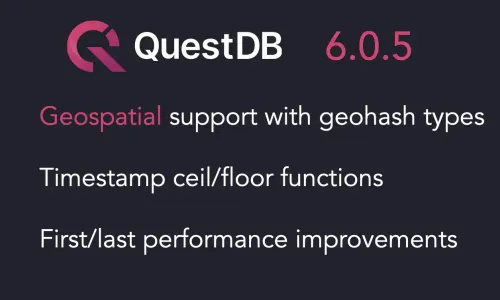
RELEASE
QuestDB 6.0.5 September release, geospatial support
by
Brian Smith
on September 13, 2021
TUTORIAL
Launch a QuestDB droplet in 1-click via the DigitalOcean marketplace
by
Brian Smith
on August 24, 2021
INFLUXDB
QuestDB 6.0.4 July release, Prometheus metrics support
by
Brian Smith
on July 16, 2021
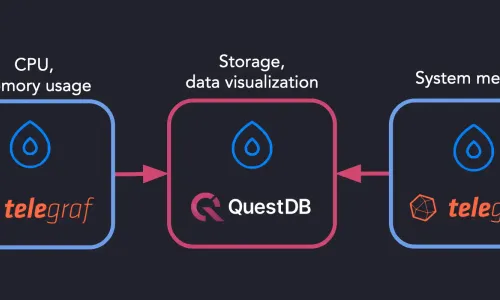
TUTORIAL
Using Telegraf and QuestDB to store metrics in a time series database
by
Gábor Boros
on July 9, 2021
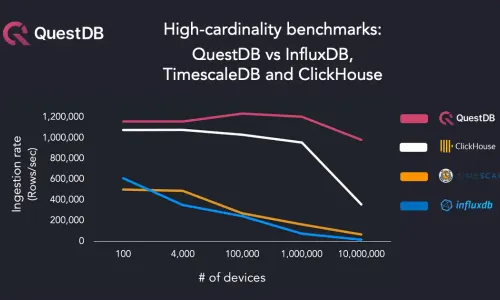
BENCHMARK
How databases handle 10 million devices in high-cardinality benchmarks
by
Vlad Ilyushchenko
on June 16, 2021
ENGINEERING
How we achieved write speeds of 1.4 million rows per second
by
Vlad Ilyushchenko
on May 10, 2021
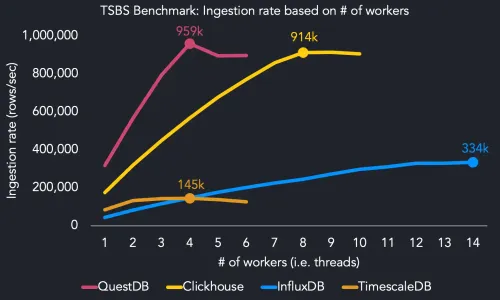
RELEASE
QuestDB version 6.0 alpha
by
Brian Smith
on April 20, 2021
TUTORIAL
Streaming on-chain Ethereum data to QuestDB
by
Yitaek Hwang
on April 12, 2021
TUTORIAL
Automating ETL jobs on time series data with QuestDB on Google Cloud Platform
by
Gábor Boros
on March 31, 2021
TUTORIAL
Running QuestDB and Prometheus on GKE Autopilot
by
Yitaek Hwang
on March 18, 2021
TUTORIAL
Real-time stock price alerts using Python, Grafana and QuestDB
by
Kovid Rathee
on March 9, 2021
POSTGRES
QuestDB 5.0.6 Release Highlights, January 2021
by
Brian Smith
on February 5, 2021
TUTORIAL
Stream heart rate data into QuestDB via Google IoT Core
by
Yitaek Hwang
on February 5, 2021
TUTORIAL
A low-code bitcoin ticker built with QuestDB and n8n.io
by
Brian Smith
on January 18, 2021
TUTORIAL
Monitoring the uptime of an application with Python, Nuxt.js and QuestDB
by
Gábor Boros
on January 13, 2021
VIEW ON TOWARDSDATASCIENCE.COM
TUTORIAL
SQL Extensions for Time-Series Data in QuestDB
by
Kovid Rathee
on January 11, 2021
KAFKA
Building a garbage-free network stack for Kafka streams
by
Vlad Ilyushchenko
on December 10, 2020
COMMUNITY
Community contribution from Alex Pelagenko improving our HTTP server
by
Alex Pelagenko
on November 16, 2020
ENGINEERING
Authentication for InfluxDB line protocol
by
Patrick Mackinlay
on October 20, 2020
DEMO
NYC taxi meter and options pricing
by
Tancrede Collard
on October 16, 2020
COMPANY
Why performance matters in time-series data
by
Nicolas Hourcard
on September 24, 2020
TUTORIAL
Fast IoT Stack with QuestDB, MQTT, and Telegraf
by
Shan Desai
on August 25, 2020
ENGINEERING
Re-examining our approach to memory mapping
by
David G. Simmons
on August 19, 2020
COMPANY
My journey making QuestDB
by
Vlad Ilyushchenko
on August 6, 2020
DEMO
Demo launch on HackerNews retrospective
by
David G Simmons
on July 1, 2020
TUTORIAL
Sending IoT sensor data from Arduino to QuestDB
by
David G. Simmons
on June 5, 2020
ENGINEERING
Things we learned about sums
by
Tancrede Collard
on May 12, 2020
BENCHMARK
Aggregating billions of rows per second with SIMD
by
Tancrede Collard
on April 2, 2020

 Star us on GitHub